Figures & data
Table 1 Demographic and baseline characteristics
Figure 1 Patient preference for study medication.
Notes: On day 2, of the 115 patients in the per-protocol population, three expressed no preference for one study drug over the other; these patients are not included in the figure. *Significant difference between treatments; P < 0.001 (n = 112; per-protocol population). P-value was calculated from a Chi-square test.
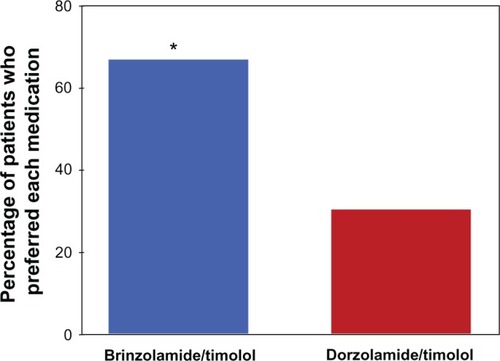
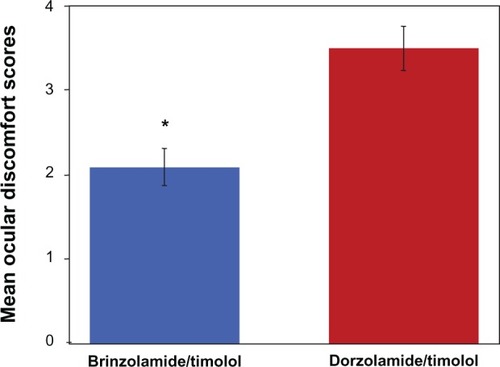
Figure 2 Mean ocular discomfort scores with standard error of the mean error bars after instillation of brinzolamide/timolol or dorzolamide/timolol.
Notes: Data from day 1 and day 2 were combined; lower scores indicate less discomfort. Data are mean ocular discomfort scores ± standard error of the mean. *Significant difference between treatments; P = 0.00014 (n = 115; per-protocol population). P-value was calculated from a Chi-square test.