Figures & data
Figure 1 Illustration of the transformation of blinks over seconds to IBIs over blink number to the distribution of IBI based on the first 30 seconds of recorded time for a normal subject. (A) Blink sequence (red dots) over time in seconds (blue timeline): 12 blinks (beyond the initial ten blinks) over 30 seconds. (B) IBI sequence (blue line) over blink number: 12 IBIs over 12 blinks. (C) IBI histogram (yellow bars) overlaid with a log normal distribution (blue curve).
Abbreviations: IBI, interblink interval; N, number; SD, standard deviation.
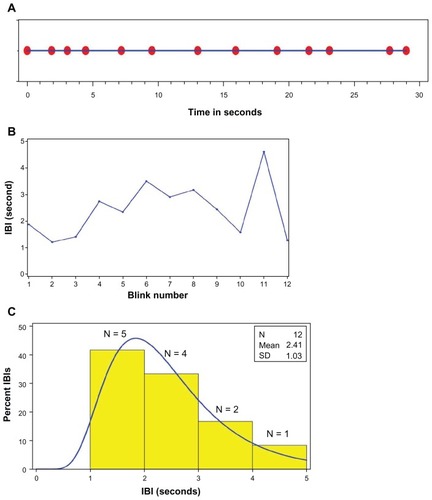
Table 1 Baseline signs and symptoms of the ten dry eye subjects included in the study
Figure 2 IBI time series for a normal and dry eye subject. IBI time series for a normal and dry eye subject plotted on log-linear axes: observed IBI (solid red or blue lines) and predicted IBI for a given blink number based on the previous blink number (dashed green line). (A) Blue = observed; green = predicted for normals; (B) red = observed; green = predicted for dry eye.
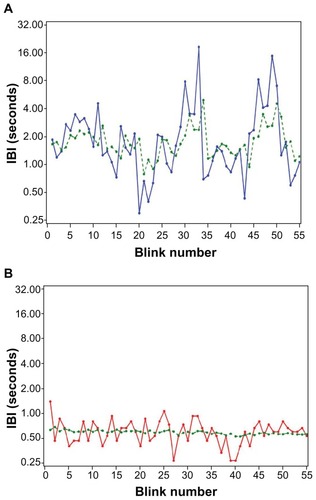
Figure 3 Log IBI standard deviations versus log IBI means for ten normal and ten dry eye subjects.
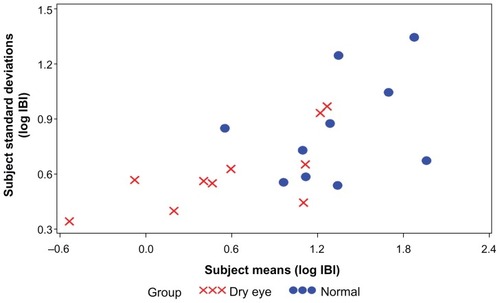
Table 2 Group means, SD from the mean, and AC for IBI and log IBI in ten normal and ten dry eye subjects
Table 3 Random effects model: IBI and log IBI in ten normal and ten dry eye subjects
Figure 4 Predicted probability of a subject having dry eye based on their mean log IBI.
Abbreviation: IBI, interblink interval.
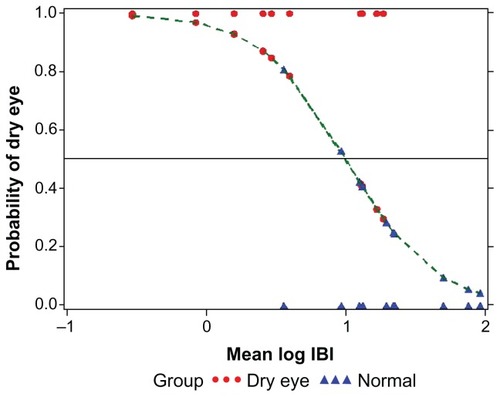
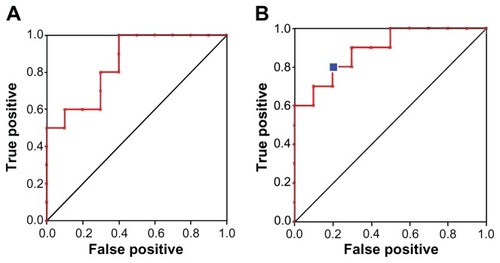
Figure 5 (A) The ROC curve based on one predictor (mean IBI) AUC = 0.85 and (B) on three predictors representing, IBI level (mean), variability (standard deviation), and relationship to past IBIs (autocorrelation), AUC = 0.89.
Abbreviations: ROC, receiver operating characteristics; IBI, interblink interval; AUC, area under the curve.