Figures & data
Figure 1 The image was obtained for one of the subjects with Artemis-2 VHFUS for ACA and ACD. A black and white, and B in color.
Abbreviations: VHFUS, very high frequency ultrasound scanner; ACA, anterior chamber angle; ACD, anterior chamber depth.
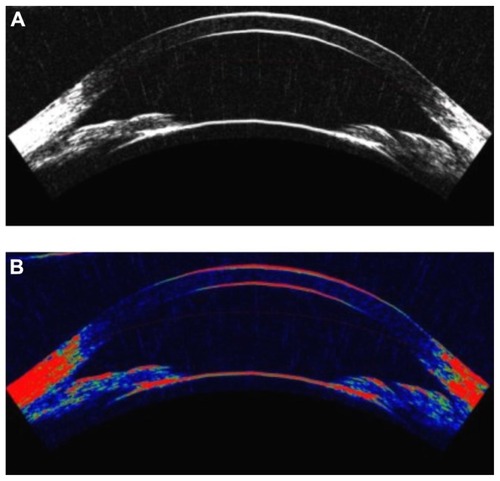
Figure 2 The image was obtained for the same subject but with UBM for ACA and ACD. A black and white, and B in color.
Abbreviations: UBM, ultrasound biomicroscopy; ACA, anterior chamber angle; ACD, anterior chamber depth.
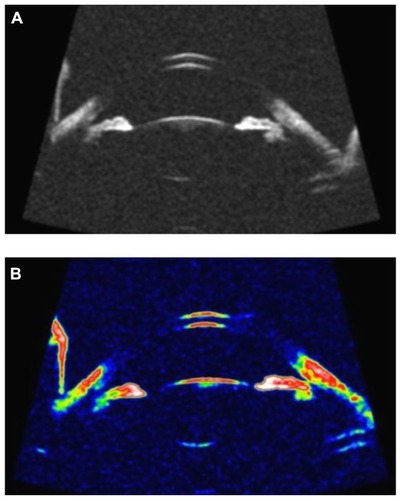
Figure 3 Bland–Altman diagram showing the difference and agreement limits of the ACA measurements obtained with UBM and the Artemis-2 VHFUS.
Abbreviations: ACA, anterior chamber angle; UBM, ultrasound biomicroscopy; VHFUS, very high frequency ultrasound scanner.
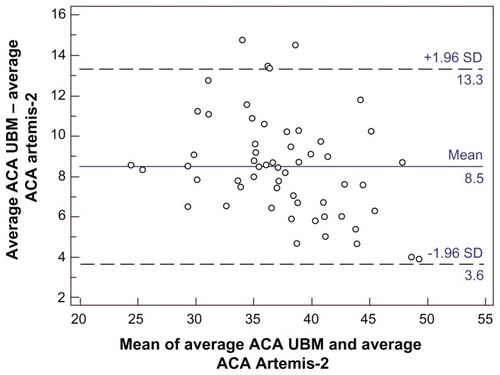
Figure 4 Bland–Altman diagram showing the difference and agreement limits of the ACD measurements obtained with the UBM and Artemis-2 VHFUS.
Abbreviations: ACD, anterior chamber depth; UBM, ultrasound biomicroscopy; VHFUS, very high frequency ultrasound; SD, standard deviation.
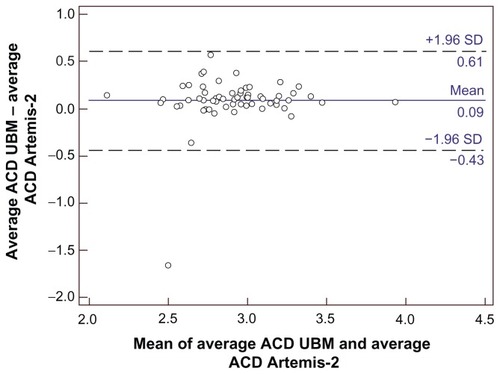
Table 1 The mean ± SD, mean differences ± SD, and LOA of ACA and ACD measurements with UBM and the Artemis-2 VHFUS