Figures & data
Figure 1 The primary duet IOL implantation approach. A sulcus-based multifocal IOL (1stQ AddOn A4DW0M) on top of a monofocal capsular-bag IOL (Bi-Flex 677). Reproduced with permission from Medicontur Medical Engineering Ltd.

Figure 2 Comparison of postoperative 1-month uncorrected visual acuities in the two study groups. For (A) distance and (B) near. UDVA LogMAR 0.00: Mann–Whitney test p = 0.1522; Kolmogorov–Smirnov test p = 0.6447 (not significant). UNVA LogMAR 0.20: Mann–Whitney test p = 0.1248; Kolmogorov–Smirnov test p ≤ 0.9999 (not significant).
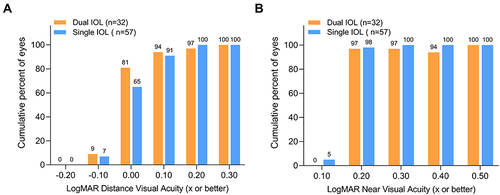
Figure 3 Comparison of postoperative 1-year uncorrected visual acuities in the two study groups. For (A) distance and (B) near. UDVA LogMAR 0.00: Mann–Whitney test p = 0.4926; Kolmogorov–Smirnov test p = 0.3648 (not significant). UNVA LogMAR 0.20: Mann–Whitney test p = 0.2738; Kolmogorov–Smirnov test p = 0.9654 (not significant).
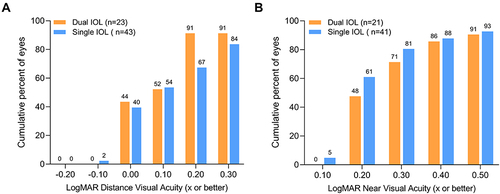
Figure 4 Distribution of residual spherical equivalents measured 1-month postoperatively in the two study groups. Mann–Whitney test p = 0.1891; Kolmogorov–Smirnov test p = 0.9981 (not significant).
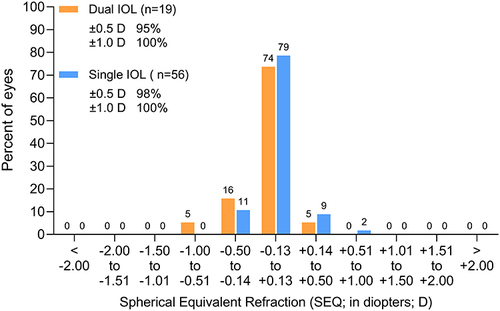
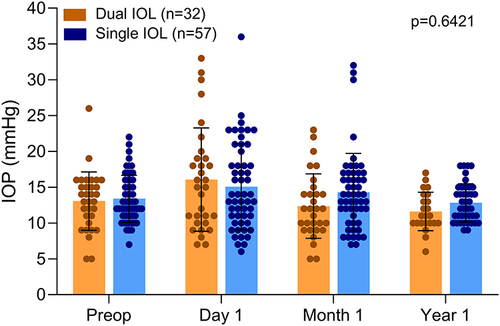
Figure 5 Intraocular pressure values in the two study groups measured preoperatively, then day-1, 1-month and 1-year postoperatively. Two-way Analysis of Variance: p = 0.6421 (not significant).