Figures & data
Table 1 Baseline Characteristics of the Patients
Figure 1 Patient disposition (safety population).
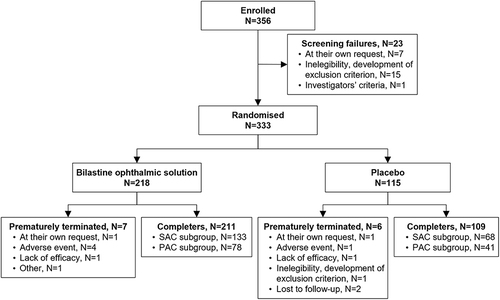
Table 2 Ocular TEAEs
Figure 2 Peak ocular discomfort and ocular tolerability for the bilastine and placebo groups at baseline (Week 0) and Week 8. Peak ocular discomfort was assessed for each eye on an integer scale of 0 to 10, where 0 represents no symptoms and 10 represents severe discomfort. Ocular symptoms were similarly rated on an integer scale of 0 to 10, where 0 represents no symptoms and 10 represents unbearable burning or stinging, excessive and continuous tearing or very severe blurring or stickiness. (A) Peak ocular discomfort; (B) burning; (C) stinging; (D) tearing; (E) blurring; (F) stickiness.
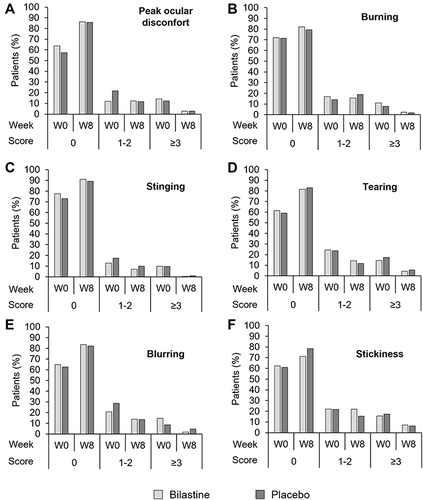
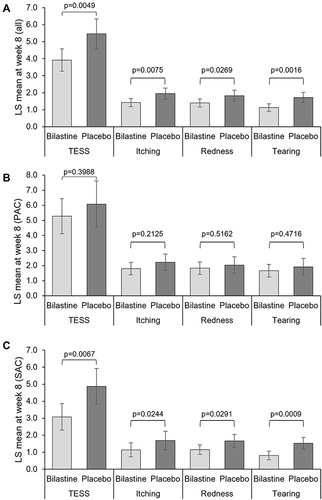
Figure 3 Eye symptoms scores (TESS and ocular symptoms) at week 8. (A) Total population (Bilastine, N=194; Placebo, N=107); (B) PAC population (Bilastine, N=69; Placebo, N=40); (C) SAC population (Bilastine, N=125; Placebo, N=67). Error bars represent 95% confidence interval. A value of “10” presented maximum symptom severity and a value of “0” the absence of the respective symptom.