Figures & data
Table 1 Comparison Between the A and B Groups Before Screen-Time Reduction
Table 2 Comparison Between the A and B Groups After Screen-Time Reduction
Table 3 Comparison of Outcomes in Group B Before and After Screen-Time Reduction
Figure 1 Comparative visual and mfERG mean outcomes between A and B groups before and four weeks after screen-hour reduction; (A) uncorrected distance visual acuity (UDVA) and corrected distance visual acuity (CDVA) expressed as logarithm of minimal angle of resolution (logMAR). (B) mfERG 5 Rings (R1, R2, R3, R4 and R5) expressed as nanovolts/ degree2 (nV/deg2). (C) mfERG 4 Quadrants (Q1, Q2, Q3, and Q4) expressed as nanovolts/ degree2 (nV/deg2).
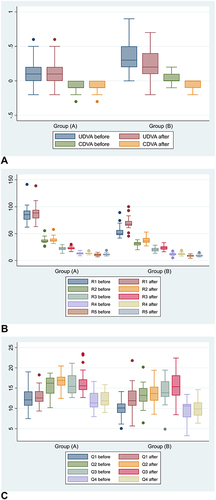
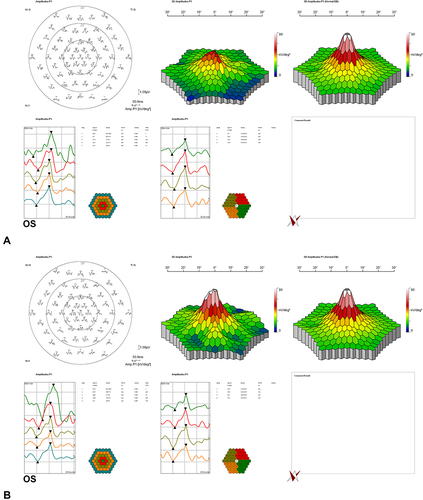
Figure 2 Multifocal electroretinography showing improved foveal responses in the CVS group. (A and B) Oculus sinister of one student before and four weeks after reduction in screen-hours.