Figures & data
Figure 1 Monozygotic twin sisters display stage I ADNIV at the age of 26 years. (A) Pedigree of female monozygotic twins who inherited the CAPN5 mutation (c.728G>T, pArg243Leu) from their father in the first ADNIV family. Black symbols represent clinically affected subjects. Open symbols represent unaffected subjects. (B) Fundus drawings of twin A recorded peripheral cystoid changes, a few sheathed vessels, and yellow spots. (C) Fundus drawings of twin B recorded peripheral pigment granularity, cystoid changes, and small areas suggesting incomplete vascularization. (D and E) Electroretinographic tracings from twins A and B show reduction of b-wave relative to the a-wave. Photopic electroretinogram (top panel) and scotopic electroretinogram (bottom panel).
Abbreviation: ADNIV, autosomal dominant neovascular inflammatory vitreoretinopathy.
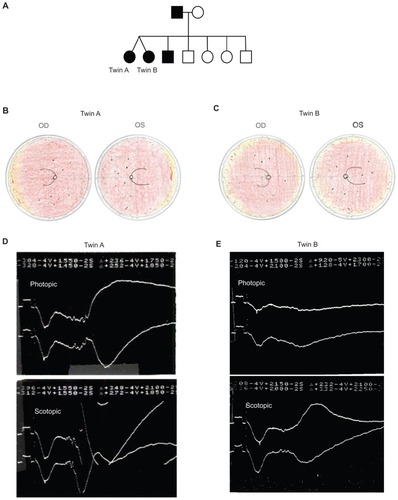
Figure 2 Twin A displays stage III ADNIV at the age of 49 years. (A) Fundus drawings record 1+ epiretinal membrane, asteroid, and cystoid macular edema OD; attenuated vessels and vascular remodeling OS; and peripheral pigmentary changes and mild vitreous cells OU. (B) Fundus photograph OD shows asteroid in the vitreous. (C) Fundus photograph OS shows a sheathed vessel, pigmentary changes (arrow) in the peripheral macula, and vascular remodeling (arrowhead). (D and E) Optical coherence tomography of the foveas shows cystoid macular edema.
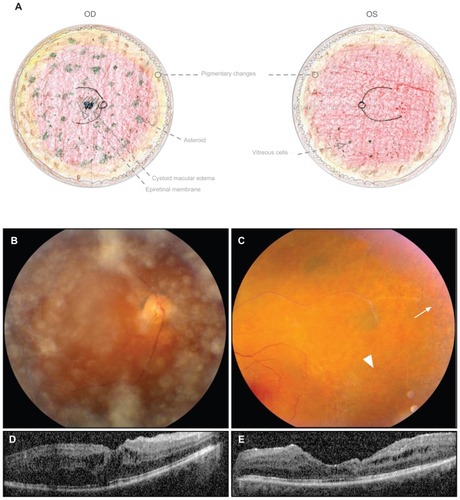
Figure 3 Twin B displays stage III ADNIV at the age of 49 years. (A) Fundus drawings record less severe epiretinal membrane and cystoid macular edema only OD. There was fibrotic vitreous traction at the disc and a fibrotic membrane over the pars plana OD. The peripheral retina showed pigmentary and atrophic changes. There were vitreous cells and vitreous bands OU. (B) Fundus photograph OD shows an epiretinal membrane and cystoid macular edema. At the optic disc there was fibrous traction (arrowhead) and pigmentary changes (arrow). (C) Fundus photograph OS shows asteroid in the vitreous. (D) Optical coherence tomography OD shows cystoid macular edema. (E) There was no cystoid macular edema OS.
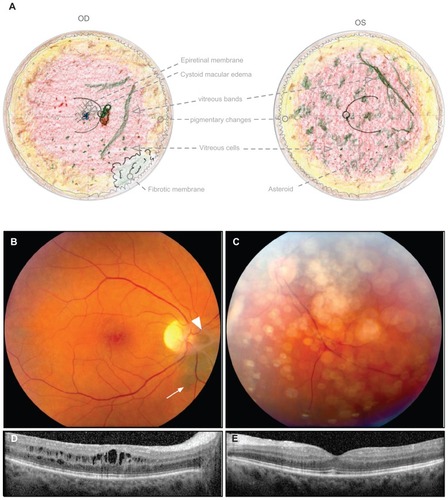
Figure 4 Goldmann visual fields at the age of 49 years. (A and B) Twin A shows central scotomas and more severe constriction of all isopters by approximately 10 degrees compared with twin B. (C and D) Twin B shows less severe peripheral constriction of isopters and a scotoma OD. (I2e, red; I4e, blue; V4e, purple).
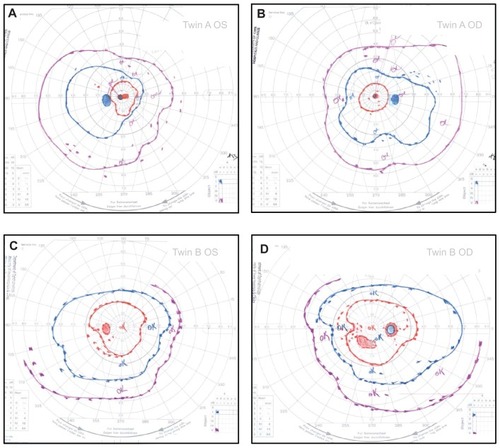
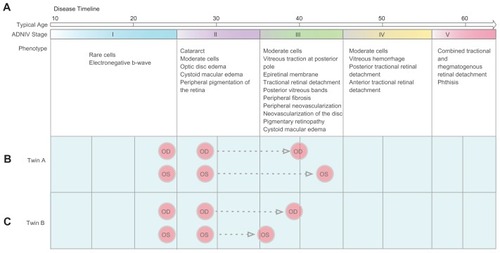
Figure 5 ADNIV disease timeline and progression. (A) ADNIV occurs in five stages (I–V), each lasting approximately 10 years and beginning at 10–30 years of age. Clinical features are listed below each stage. (B) Twin A progressed to more severe stage III disease with some asymmetry between eyes. Her epiretinal membranes and cystoid macular edema were worse in the left eye and required surgery. There was also more peripheral field loss. (C) Twin B progressed to less severe stage III disease with asymmetry between eyes. Cystoid macular edema was worse in the right eye.