Figures & data
Figure 1 OCT pachymetry and ETM demonstrating normal epithelial thickness OD but marked thinning centrally (red arrow) and thickening peripherally (black arrows) OS in a “doughnut” pattern consistent with KC.
Notes: and present a keratorefractive surgery candidate with frank KC as observed by concordant abnormal findings on both ETM and Tomography.
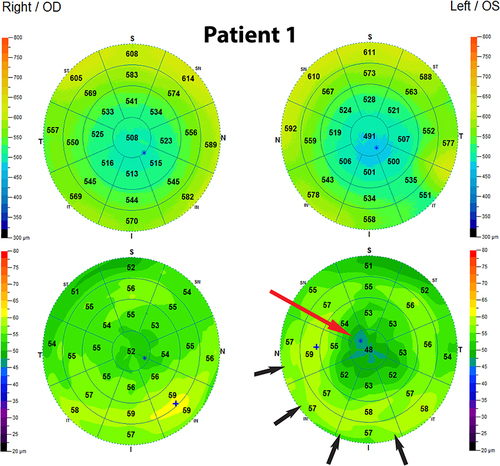
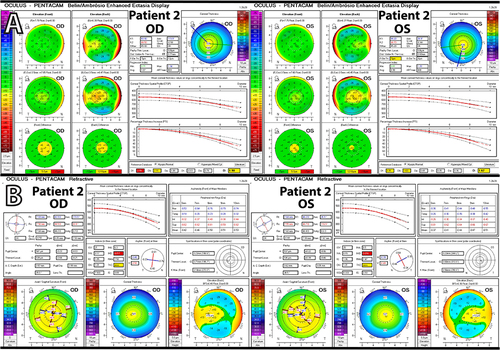
Figure 2 (A) Pentacam enhanced ectasia display maps demonstrating significant central thinning OU. (B) Pentacam refractive maps.
Notes: and present a keratorefractive surgery candidate with frank KC as observed by concordant abnormal findings on both ETM and Tomography.
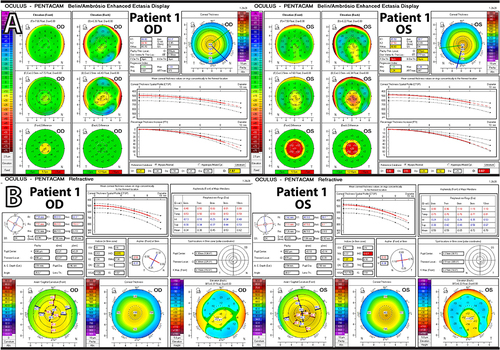
Figure 3 OCT pachymetry and ETM demonstrating normal epithelial thickness OU.
Notes: and present a keratorefractive surgery candidate with suspected KC as observed by discordant findings on ETM and Tomography.
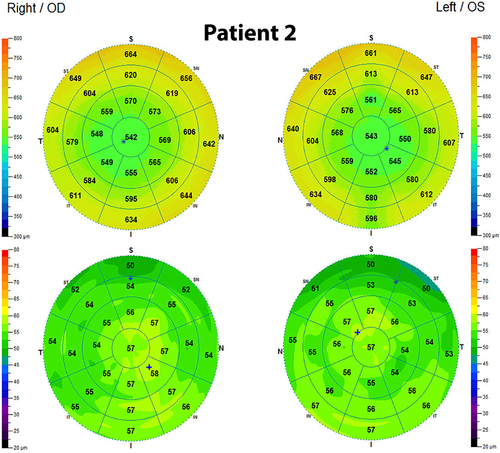
Figure 4 (A) Pentacam enhanced ectasia display maps suggestive of central thinning. (B) Pentacam refractive maps.
Notes: and present a keratorefractive surgery candidate with suspected KC as observed by discordant findings on ETM and Tomography.