
Figures & data
Table 1 Preoperative Characteristics
Figure 1 Visual and refractive outcomes are shown above. The percentage of eyes achieving 20/× or better is shown for both corrected and uncorrected distance visual acuity on the left. The distribution of postoperative spherical equivalent is shown on the right.
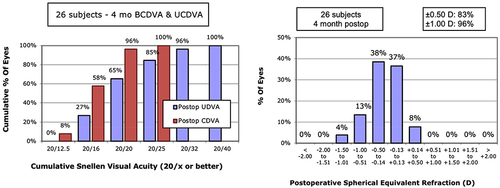
Figure 2 Uncorrected visual acuity outcomes are shown. The percentage of eyes achieving 20/× or better is shown for uncorrected distance, intermediate and near visual acuity.
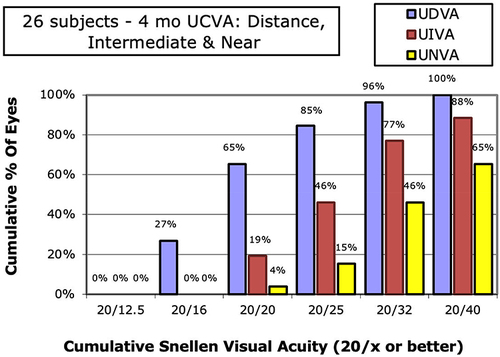
Table 2 Results from the Subject Questionnaire Evaluating Spectacle Independence at the 4-Month Postoperative Visit are Summarized