
Figures & data
Figure 1 Corneal surface coordinate system. For a point moving along the curve, is its velocity, α the angle of motion, and
is its acceleration parallel to the z axis.
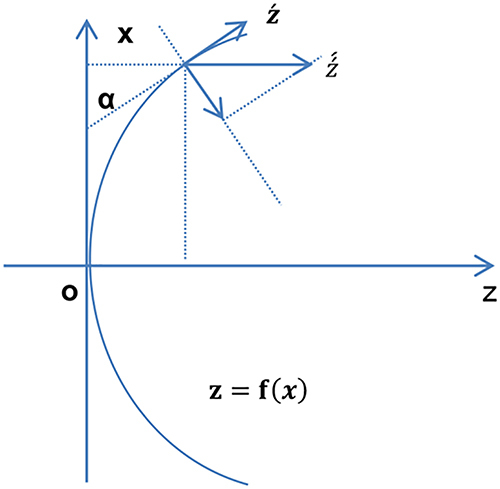
Figure 2 Refractive trajectory of light passing through the anterior surface of the cornea. The angle of motion α is also the angle of incidence, θ the angle of reflection; and n1 and n2 are the refractive indices of air and cornea respectively.
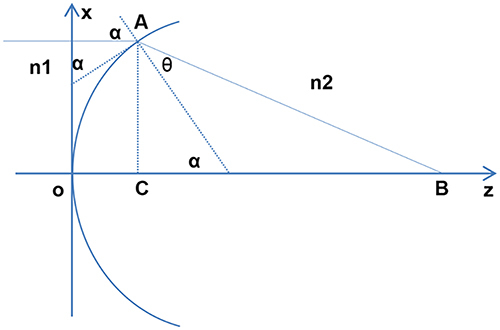
Figure 3 Refractive trajectory of light passing through the posterior surface of the cornea. β is the angle of motion; γ the angle of reflection; and n2 and n3 are the refractive indices of the cornea and aqueous humor, respectively.
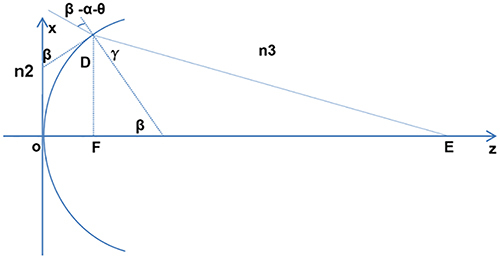
Table 1 Characteristics of the Patients
Figure 4 Distribution of corneal Q value at 3.0, 4.0, 5.0, 6.0, and 7.0 mm aperture diameters, anteriorly and posteriorly, in 915 individuals. The corneal Q values of the anterior surface were: −0.09±0.21, −0.14±0.16, −0.15±0.13, −0.17±0.11, and −0.20±0.11, respectively, and those of posterior surface were 0.23±0.49, 0.06±0.29, −0.01±0.22, −0.07±0.16, and −0.08±0.15, respectively.
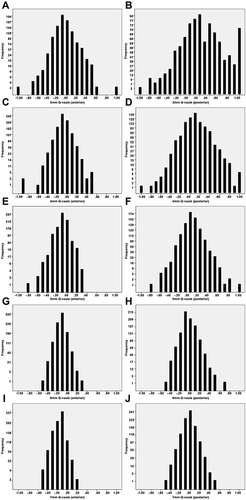
Figure 5 Distribution of corneal longitudinal spherical aberration (LSA) values at 3.0, 4.0, 5.0, 6.0, and 7.0 mm aperture diameters, anteriorly and wholly, in 915 individuals. The corneal LSA values of the anterior surface were: 0.39±0.19 D, 0.63±0.27 D, 0.97±0.36 D, 0.90±0.30 D, and 0.83±0.29 D, respectively, and the mean whole corneal LSA values were 0.26±0.20 D, 0.44±0.27 D, 0.70±0.36 D, 0.66±0.30 D, and 0.59±0.28 D respectively.
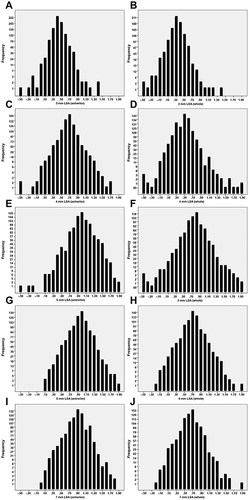
Table 2 Results of Correlation Analyses