278
Views
1
CrossRef citations to date
0
Altmetric
ORIGINAL RESEARCH

Visual Acuity in Aniridia and WAGR Syndrome

, , & ORCID Icon
Pages 1255-1261 | Received 26 Jan 2023, Accepted 24 Apr 2023, Published online: 01 May 2023

Figures & data

Table 1 Characteristics of Aniridia and WAGR Spectrum Subjects

Table 2 Visual Acuity in Aniridia and WAGR Spectrum Subjects

Figure 1 Scatter plots for LogMAR values in aniridia and WAGR spectrum subjects. (A) Values for both eyes in aniridia (N=50) and WAGR spectrum (N=50) subjects. (B) Values for the better-seeing eye in aniridia (N=25) and WAGR spectrum (N=25) subjects. (C) Values for the worse-seeing eye in aniridia (N=25) and WAGR spectrum (N=25) subjects. Heavy horizontal lines indicate the mean and lighter horizontal lines indicate the standard deviation for each group. The analyses of all eyes and better-seeing eyes comparing aniridia and WAGR spectrum subjects were statistically significantly different in both analyses.

Abbreviations: BCVA, best-corrected visual acuity; WAGR, WAGR spectrum (syndrome) subjects.
Figure 1 Scatter plots for LogMAR values in aniridia and WAGR spectrum subjects. (A) Values for both eyes in aniridia (N=50) and WAGR spectrum (N=50) subjects. (B) Values for the better-seeing eye in aniridia (N=25) and WAGR spectrum (N=25) subjects. (C) Values for the worse-seeing eye in aniridia (N=25) and WAGR spectrum (N=25) subjects. Heavy horizontal lines indicate the mean and lighter horizontal lines indicate the standard deviation for each group. The analyses of all eyes and better-seeing eyes comparing aniridia and WAGR spectrum subjects were statistically significantly different in both analyses.

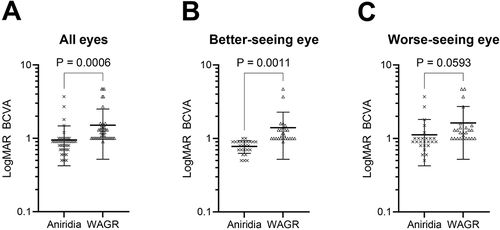
Table 3 Average Visual Function Thresholds in Aniridia and WAGR Spectrum Subjects