Figures & data
Table 1 Physical properties and composition of normal tear fluidCitation11,Citation13–Citation16
Figure 1 Molecular structure of loteprednol etabonate and metabolism of loteprednol etabonate to inactive metabolites.
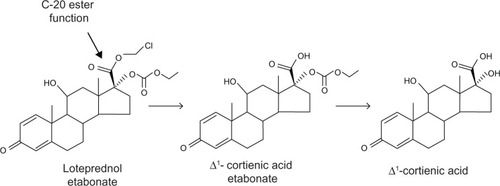
Table 2 Comparison of 0.5% loteprednol etabonate suspension and gel formulations
Figure 2 Viscosity of loteprednol etabonate 0.5% gel as a function of applied shear stress.
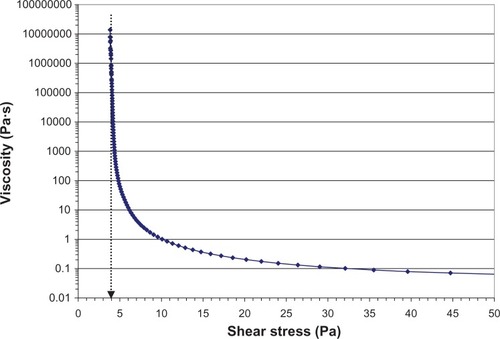
Figure 3 Delivery of LE 0.5% suspension and LE 0.5% gel from the dropper bottle.
Abbreviation: LE, loteprednol etabonate.
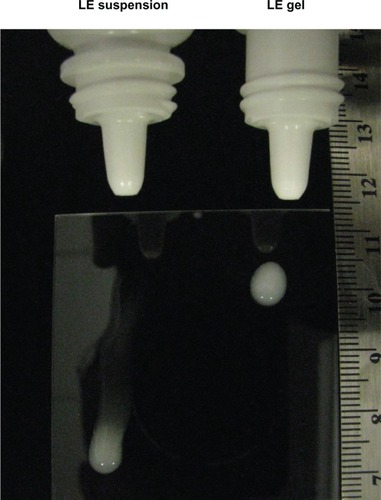
Figure 4 Sedimentation of LE 0.5% suspension and LE 0.5% gel formulations under 120× g at 1000 rpm (116–145× g) for 24 hours using a LUMiSizer dispersion analyzer (LUM GmbH, Berlin, Germany).
Abbreviation: LE, loteprednol etabonate.
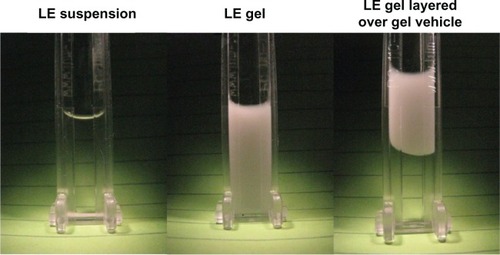
Figure 5 Drop weight (A), amount of dose delivered per drop (B), and resulting drop potency (C) of a representative lot of LE 0.5% gel.
Abbreviation: LE, loteprednol etabonate.
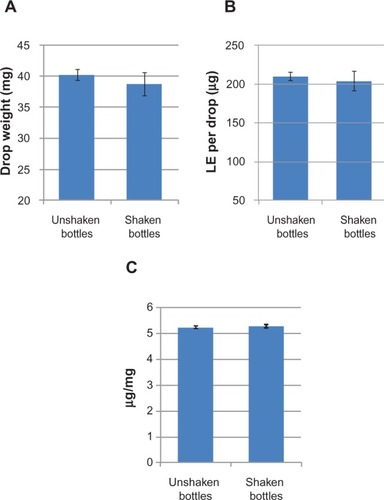
Figure 6 Viscosity of loteprednol etabonate gel 0.5%, suspension 0.5%, and ointment 0.5% at low shear rates before (A) and after (B) dilution with simulated tear fluid (3:1 dilution with Hank’s Balanced Salt Solution).
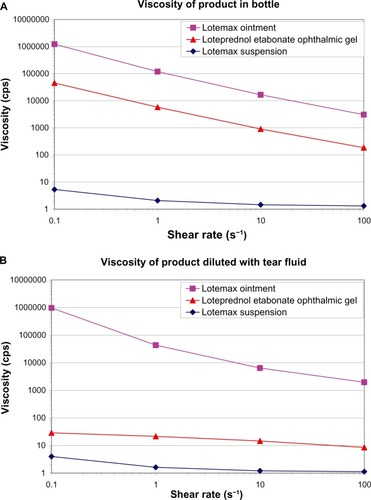
Table 3 Complete resolution of ACC and grade 0 (no) pain – day 8 and day 15 (ITT populations)Citation60,Citation61
Table 4 Drug-related ocular treatment emergent adverse events occurring at an incidence of ≥1% (safety populations)Citation60,Citation61