
Figures & data
Table 1 Participants’ Demographic Characteristics and Prevalence of DES
Table 2 Distributions of Eye Risk Factors in Relation to DES Symptom Severity
Table 3 The Distribution of Online Learning Risk Factors in Relation to Digital Eye Strain Symptom Severity
Figure 1 Frequency of symptoms in relation to DES.
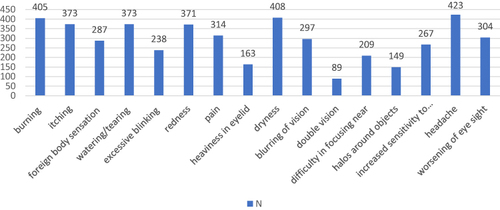
Figure 2 Frequency and intensity of burning as a symptom of DES.
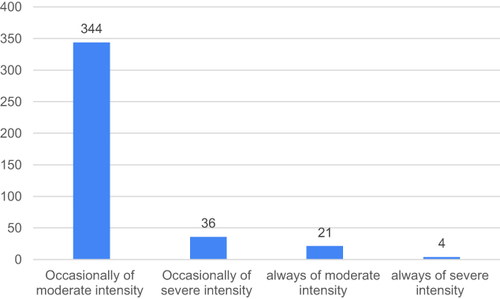
Figure 3 Frequency and intensity of itching as a symptom of DES.
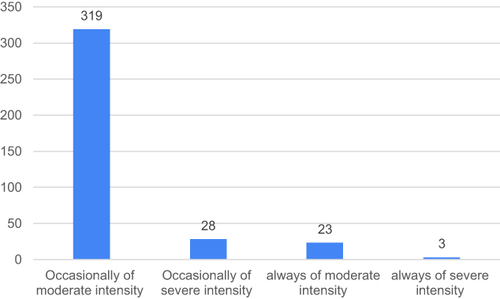
Figure 4 Frequency and intensity of redness as a symptom of DES.
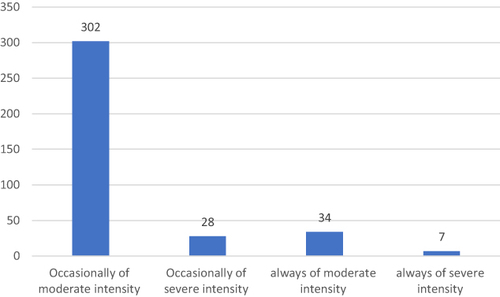
Figure 5 Frequency and intensity of foreign body sensation as a symptom of DES.
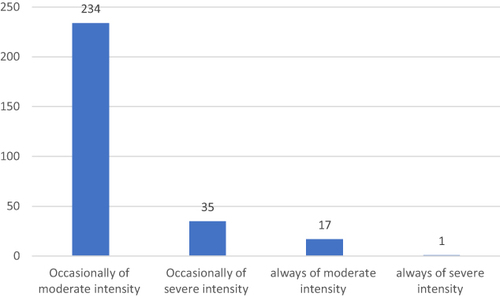
Figure 6 Frequency and intensity of watering/tearing as a symptom of DES.
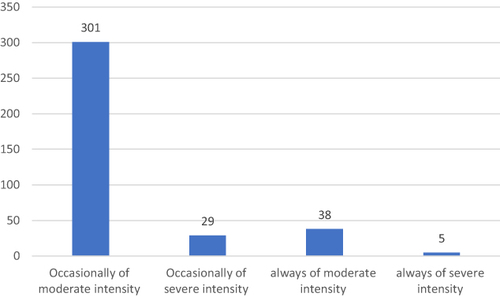
Figure 7 Frequency and intensity of excessive blinking as a symptom of DES.
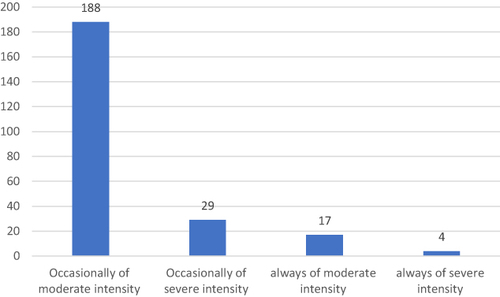
Figure 8 Frequency and intensity of pain as a symptom of DES.
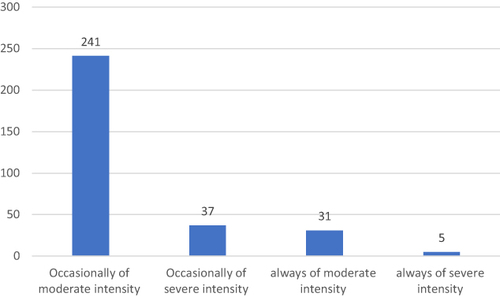
Figure 9 Frequency and intensity of heaviness in the eyelids as a symptom of DES.
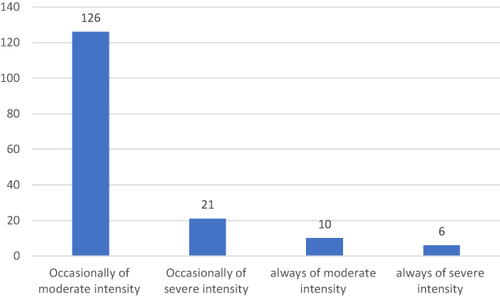
Figure 10 Frequency and intensity of dryness as a symptom of DES.
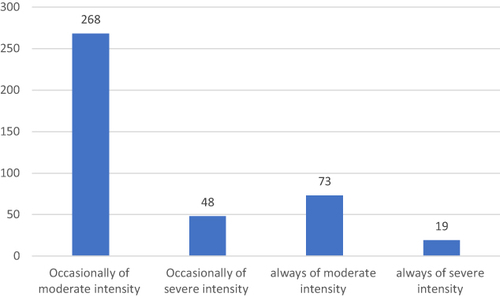
Figure 11 Frequency and intensity of blurred vision as a symptom of DES.
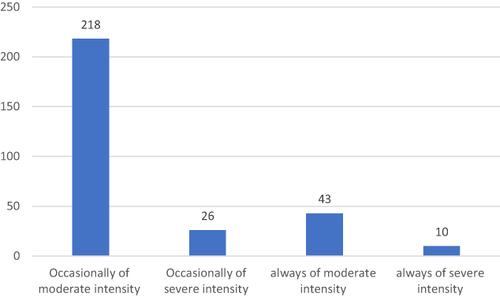
Figure 12 Frequency and intensity of double vision as a symptom of DES.
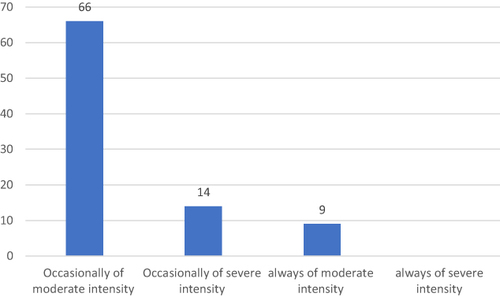
Figure 13 Frequency and intensity of difficulty in focusing near as a symptom of DES.
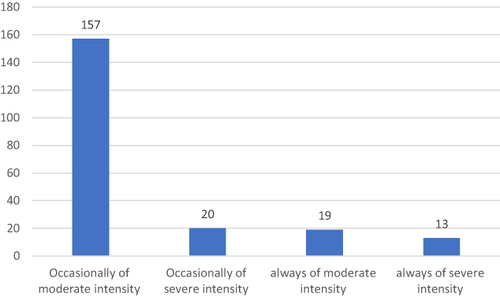
Figure 14 Frequency and intensity of halos around objects as a symptom of DES.
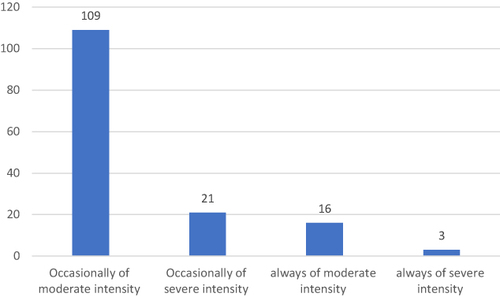
Figure 15 Frequency and intensity of increased sensitivity to light as a symptom of DES.
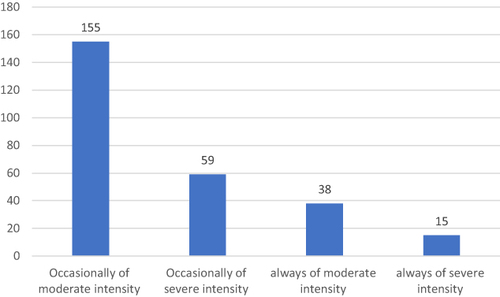
Figure 16 Frequency and intensity of headache as a symptom of DES.
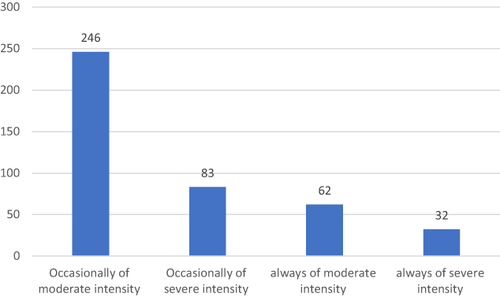
Figure 17 Frequency and intensity of worsening of eyesight as a symptom of DES.
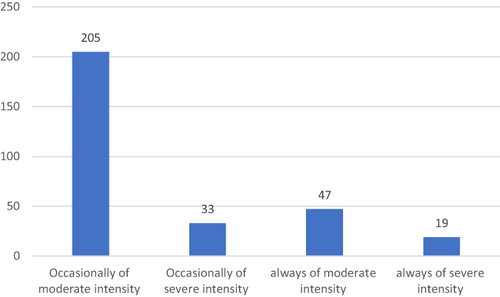
Table 4 Ordinal Regression Model of Risk Factors Associated with DES