
Figures & data
Figure 1 Flowchart of the selection process.
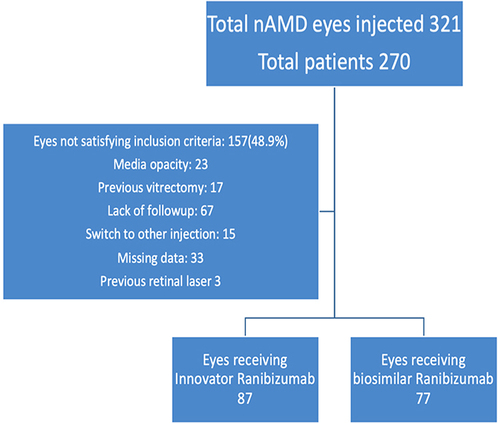
Table 1 Demographic and Baseline Characteristics of Patients
Table 2 Improvement in BCVA and CMT of Patients After Treatment
Figure 2 (A) Box plot showing Baseline and Treatment Period Visual Acuity (BCVA) for IRM. (B) Box plot showing Baseline and Treatment Period Visual Acuity (BCVA) for BRM.
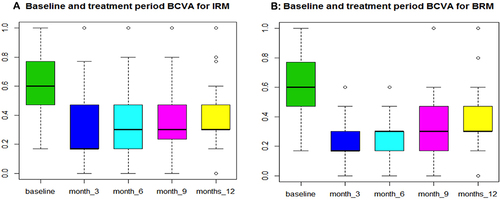
Table 3 SRF and IRF Levels in Patients After Treatment
Figure 3 (A) Box plot showing Baseline and Treatment Period CMT for IRM. (B) Box plot showing Baseline and Treatment Period CMT for BRM.
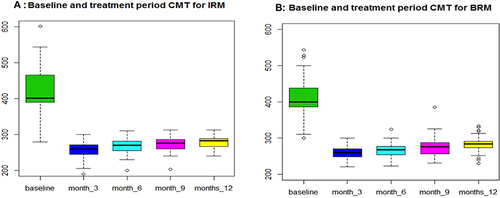
Table 4 Distribution of IRM and BRM Doses During 12 Months Study
Table 5 Adverse Events