
Figures & data
Table 1 Demographics and Characteristics of DED Negative (DED-) versus DED Positive (DED+) Subjects According to DEWSII Criteria
Figure 1 The prevalence of DED in % based on DEWS II criteria, subdivided based on dry eye tests.
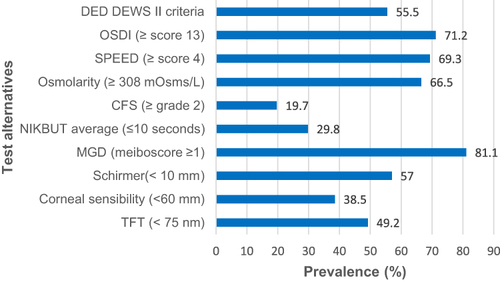
Table 2 Association Between DED and Its Signs and Symptoms with Age and Gender in a Simple Logistic Regression Model
Table 3 Distribution of Abnormal Tests in the Study Population (%)
Table 4 Correlation Matrix of Objective DED Test and Subjective Questionnaires, Spearman`s Rho Correlation Coefficient
Figure 2 Distribution of: osmolarity grading severity (A), corneal fluorescein staining (CFS) (B), abnormal non-invasive keratography breakup time (NIKBUT) (C) in the study population.
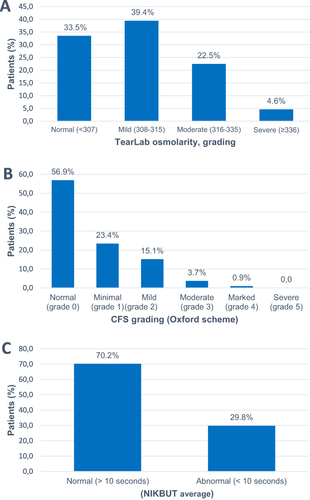
Figure 3 Distribution of: the ocular surface disease index (OSDI) questionnaire score (A), the standard patient evaluation of eye dryness questionnaire (SPEED) score in the study population (B).
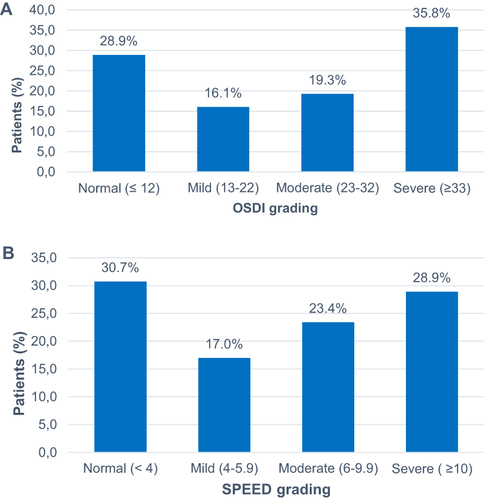
Table 5 Matrix Results of the Severity of Dry Eye Symptoms Based on the Ocular Surface Disease Index (OSDI) and the Number of Positive DED Signs (Osmolarity, NIKBUTavg, CSF)