
Figures & data
Table 1 Pre and Postoperative Visual, Refractive, and Tomographic Data in the studied population
Table 2 Cases with Intense Keratometric Flattening Effect
Figure 1 Pre- and post-operative steeper keratometry (A), flatter keratometry (B) and Pre- and post-operative spherical equivalent (C).
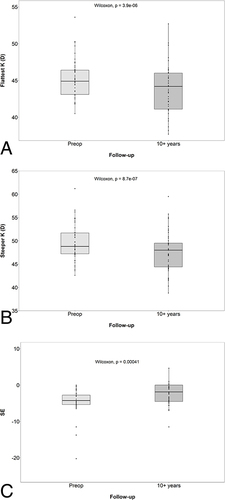
Figure 2 Top: preoperative Scheimpflug analysis; Bottom: 13 years postoperative Scheimpflug analysis of the case presenting an extreme flattening of 11.5D in the steeper keratometry.
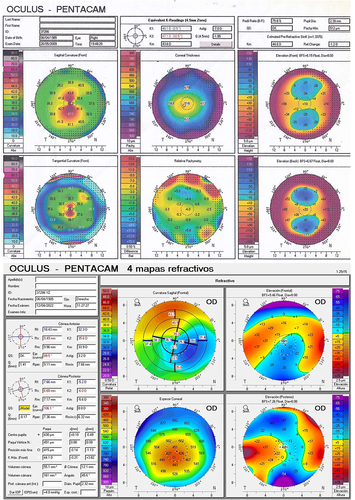
Figure 3 (A) Postoperative anterior segment optical coherence tomography of the case presenting an extreme flattening of 11.5D in the steeper keratometry; (B) Pentacam densitometric values of the same patient.
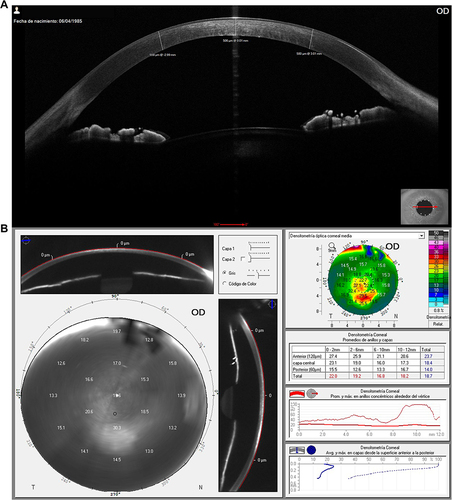
Table 3 Corneal Densitometry Measurements at 10 Years or More After CXL