
Figures & data
Table 1 Demographic and Baseline Glaucoma Status Data for the Study Sample (n=37*)
Table 2 Mean Intraocular Pressure (IOP) and Medication Use and Changes from Baseline at Each Study Time Point. Baseline for IOP Was After Medication Washout, While Baseline for Medications Was Before Washout
Figure 1 Responder analysis of percent reduction in intraocular pressure at 12 months in all eyes and those unmedicated at month 12.
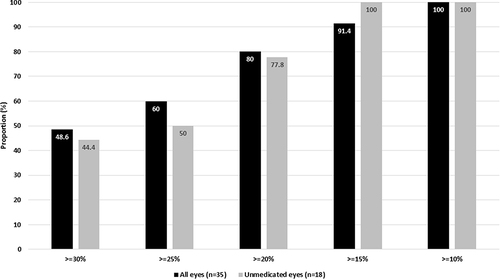
Figure 2 Endothelial cell density over time. Error bars represent standard deviation.
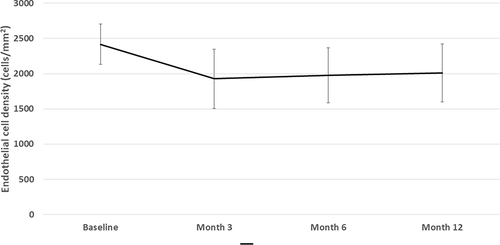
Table 3 Comparison of Outcomes in the Current Study Compared with Those Reported in Studies of Trabecular Meshwork Bypass Devices and Other Transluminal Dilation Procedures in Combination with Phacoemulsification