Figures & data
Table 1 Baseline demographic and glaucoma status
Figure 1 Means with 95% confidence intervals for IOP at each time point for the KDB-alone and KDB-phaco groups.
Notes: *A significant difference in IOP levels between groups was observed only at month 3 (P=0.031).
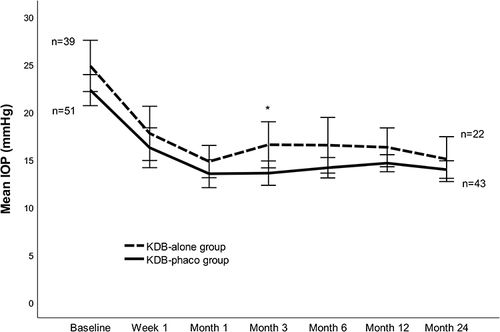
Figure 2 Means with 95% confidence intervals for number of medications at each time point for the KDB-alone and KDB-phaco groups.
Notes: *Patients in the KDB-phaco group had significantly fewer medications than patients in the KDB-alone group from month 1 to month 24.
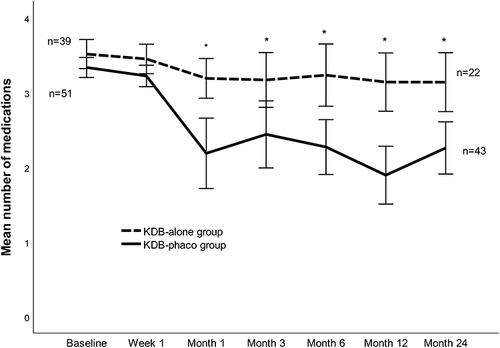
Table 2 Target IOP levels at baseline and at month 24
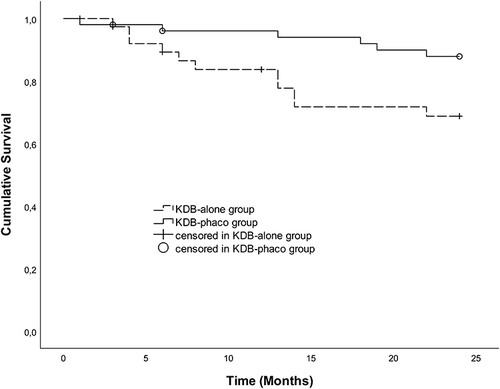
Figure 3 Kaplan–Meier cumulative survival in the KDB-alone and KDB-phaco groups.
Notes: Eyes in the KDB-phaco group were less likely to need further surgery within 24 months (P=0.026, log-rank test).