Figures & data
Figure 1 (A) OCT B-scan used to analyze subretinal fluid and choroidal thickness in exudative cCSC pachychoroid eye. Subretinal fluid height was assessed by manually measuring the distance between the external limiting membrane and the RPE at the fovea (yellow arrow). Sub-foveal choroidal thickness was measured with the caliper function of structural OCT. The SFCT was measured from Bruch’s membrane to the chorio-retinal interface perpendicularly in the center of the fovea (red arrow); (B) Swept-source OCTA image of the choriocapillaris in non-exudative fellow cCSC pachychoroid eye used to analyze choriocapillaris flow deficits percentage. The CC images were binarized using the Phansalkar method using a radius of 15 pixels to calculate the choriocapillaris FD percentage.
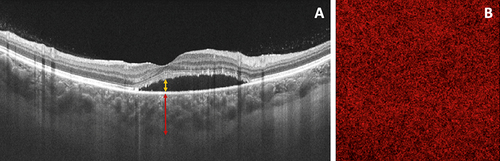
Table 1 The Clinical and Medical Characteristics of Subjects Included in the Analysis
Table 2 Functional and Anatomical (OCT) Analysis in cCSC Affected Eyes. Data and Comparisons
Table 3 Functional and Anatomical (OCT and OCTA) Analysis in cCSC Fellow Eyes. Data and Comparisons
Figure 2 Graph showing mean sub-foveal choroidal thickness changes in affected and unaffected eyes throughout the follow-up. (*) Comparison with baseline values.
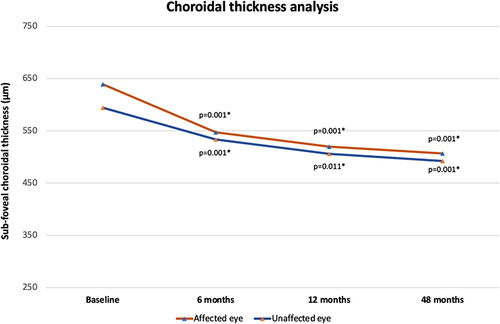
Figure 3 Choriocapillaris SS-OCTA scans in non-exudative fellow cCSC pachychoroid eye and continuously treated with eplerenone. Scans were acquired at baseline visit and 6 months, 12 months, and 48 months. The figure shows the CC FD % changes throughout the follow-up.
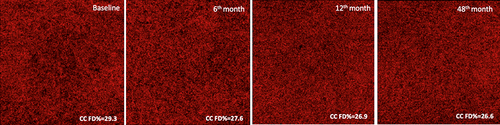
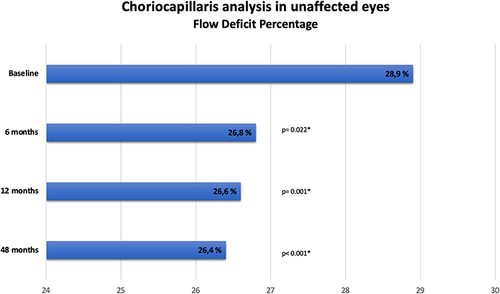
Figure 4 Graph showing mean choriocapillaris FD% modifications in unaffected eyes throughout the follow-up. (*) Comparison with baseline values.