Figures & data
Table 1 Pre-Op and Post-Op Values for Average K and Kmax, Pre-Op Measured and Manifest Cylinder, and Post-Op Manifest Cylinder
Table 2 Best Corrected Visual Acuities Pre-Op and Post-Op by Snellen Chart Measurements
Table 3 Gains in Best Corrected Visual Acuity
Table 4 Zernike Polynomials for 6th Order Higher-Order Aberrations and for Grouped Polynomials
Table 5 Average Amount of Epithelial Compensation of the Stroma
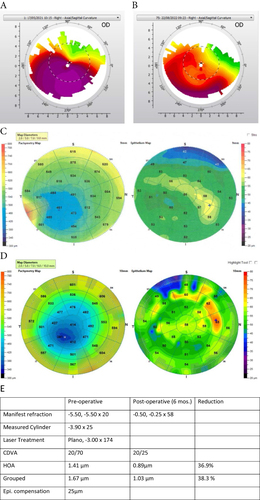
Figure 1 (A–E) Case 1: 49 year old male. (A) Pre-op topography, (B) Post-op topography, (C) Pre-op OCT pachymetry and epithelial thickness map, (D) Post-op OCT pachymetry and epithelial thickness map, (E) patient data.
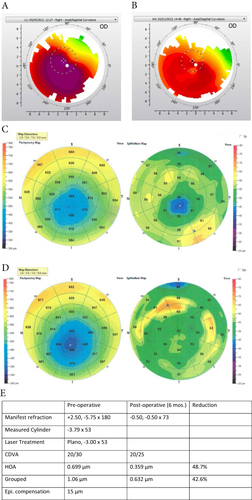
Figure 2 (A–E) Case 2: 32 year old male. (A) Pre-op topography, (B) Post-op topography, (C) Pre-op OCT pachymetry and epithelial thickness map, (D) Post-op OCT pachymetry and epithelial thickness map, (E) patient data.
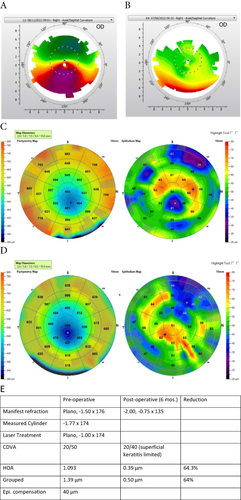
Figure 3 (A–E) Case 3: 20 year old female: (A) Pre-op topography, (B) Post-op topography, (C) Pre-op OCT pachymetry and epithelial thickness map, (D) Post-op OCT pachymetry and epithelial thickness map, (E) patient data.