
Figures & data
Table 1 Baseline Clinical Characteristics and Cytokine Levels in Patients Treated by Intravitreal Ranibizumab Injection (IRI) Alone (IRI Group) and by IRI Combined with Subtenon Triamcinolone Acetonide Injection (Combination Group)
Figure 1 Time course of best-corrected visual acuity, central macular thickness, and aqueous flare value (A) Best-corrected visual acuity improved significantly over time in both the intravitreal ranibizumab injection (IRI) group (dotted line; P < 0.001) and combination group (IRI plus subtenon triamcinolone acetonide; solid line; P < 0.001). The trend profile was not significantly different between the two groups (P = 0.729). (B) Central macular thickness improved significantly over time in both the IRI (dotted line; P < 0.001) and combination groups (solid line; P<0.001). The trend profile was not significantly different between the two groups (P = 0.698). (C) Aqueous flare values improved significantly over time in both the IRI (dotted line; P = 0.017) and combination groups (solid line; P < 0.001). The trend profile was not significantly different between the two groups (P = 0.476). *P value for group comparison (P<0.05).
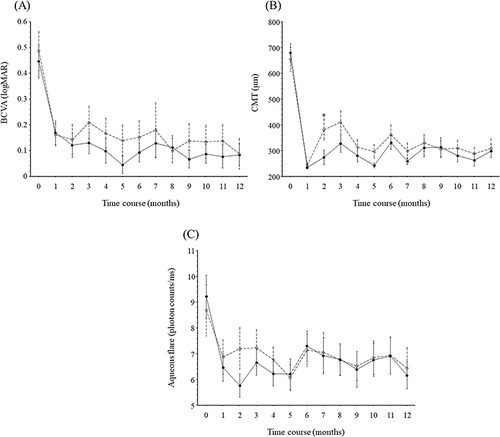
Table 2 Features of Intravitreal Ranibizumab Injection (IRI) in Patients Treated by IRI Alone (IRI Group) and by IRI Combined with Subtenon Triamcinolone Acetonide Injection (Combination Group)
Figure 2 Time course of intraocular pressure. Intraocular pressure (IOP) increased significantly over time in the combination group (intravitreal ranibizumab injection [IRI] plus subtenon triamcinolone acetonide injection; solid line; P = 0.006), but no significant increase was found in the IRI-only group (dotted line; P = 0.282). The trend profile of IOP was significantly different between the two groups (P = 0.007). *P value for group comparison (P < 0.05).
![Figure 2 Time course of intraocular pressure. Intraocular pressure (IOP) increased significantly over time in the combination group (intravitreal ranibizumab injection [IRI] plus subtenon triamcinolone acetonide injection; solid line; P = 0.006), but no significant increase was found in the IRI-only group (dotted line; P = 0.282). The trend profile of IOP was significantly different between the two groups (P = 0.007). *P value for group comparison (P < 0.05).](/cms/asset/440eeef9-b080-4bb9-b7c7-d623190fb93e/doph_a_12159698_f0002_c.jpg)