Figures & data
Table 1 Patient Demographics
Table 2 Mean Differences Between SIRC and Corneal Power Difference Maps
Table 3 Corneal Power Difference Map Comparisons by Study
Figure 1 Box plot representations of the difference between †SIRC and corneal power difference maps (∆maps) obtained by the Pentacam for LASIK, PRK, and SMILE (A) overall surgical groups (B) high myopia (C) moderate myopia (D) low myopia. Corneal power ∆maps that were significantly different from SIRC are marked with an*. There were only 2 low myopia patients in the SMILE group, thus no meaningful conclusions can be drawn regarding low myopia and SMILE.
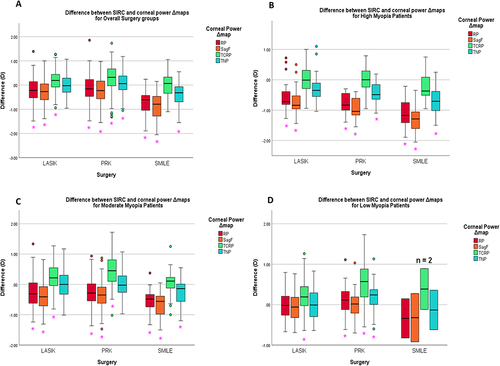
Figure 2 Linear regression analysis between SIRC and corneal power difference maps (∆maps) of overall groups for (A) LASIK TNP ∆map 5mm pupil, (B) PRK TNP ∆map 5mm apex, and (C) SMILE TCRP ∆map 4mm apex vs †SIRC.
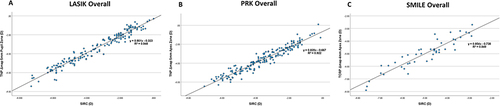
Figure 3 Bland-Altman Agreement plots of most accurate corneal power difference maps (∆maps) for (A) LASIK overall, (B) PRK overall and (C) SMILE overall compared with †SIRC. The solid line represents the mean difference between the corneal power ∆maps and the †SIRC. The dotted lines represent the 95% LoA = mean ± 1.96*SD.
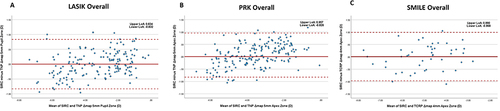
Figure 4 Bland-Altman Agreement plots of most accurate corneal power difference maps (∆maps) for (A) LASIK high myopia, (B) PRK high myopia and (C) SMILE high myopia compared with †SIRC. The solid line represents the mean difference between the corneal power ∆maps and the †SIRC. The dotted lines represent the 95% LoA = mean ± 1.96*SD.
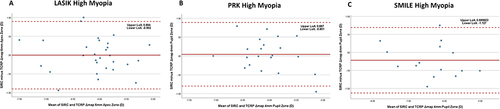
Figure 5 Bland-Altman Agreement plots of most accurate corneal power difference maps (∆maps) for (A) LASIK moderate myopia, (B) PRK moderate myopia and (C) SMILE moderate myopia compared with †SIRC. The solid line represents the mean difference between the corneal power ∆maps and the †SIRC. The dotted lines represent the 95% LoA = mean ± 1.96*SD.
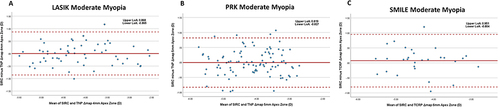
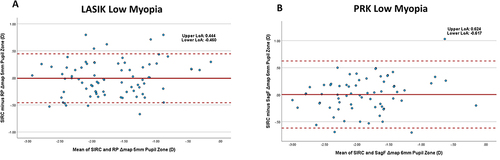
Figure 6 Bland-Altman Agreement plots of most accurate corneal power difference maps (∆maps) for (A) LASIK low myopia, and (B) PRK low myopia compared with †SIRC. No plot for SMILE low myopia group is shown given the small sample size of 2. The solid line represents the mean difference between the corneal power ∆maps and the †SIRC. The dotted lines represent the 95% LoA = mean ± 1.96*SD.