
Figures & data
Box 1 Exclusion criteria
Table 1 Enrollment by site
Table 2 Enrollment by Treatment Group
Table 3 Significant improvements in total corneal higher order aberrations in the central 6 mm of the cornea were seen between baseline and each of week 2 and week 4 for the combination drop, while no significant improvement was seen for patients treated with cyclosporine alone
Figure 1 Significant improvements in HOAs were seen from baseline to week 2 and week 4 in eyes treated with the combination drop, whereas no significant change in HOAs was seen with cyclosporine.
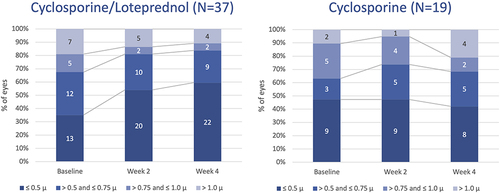
Figure 2 Multifocal candidacy almost doubled among eyes receiving CsA–LE vs those taking CsA alone.
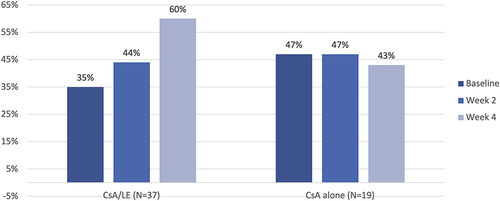
Figure 3 Both cyclosporine/–loteprednol and cyclosporine alone significantly reduced corneal staining (P<0.0001 for both drops for baseline vs 2 and 4 weeks, paired t-test).
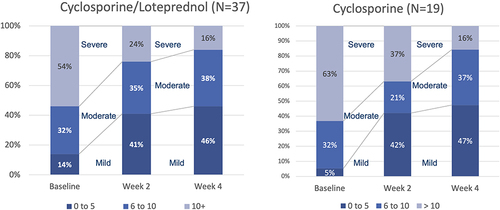
Figure 4 Corneal staining improved significantly in both groups from baseline to both week 2 and 4 (P<0.00001, paired t-test for all comparisons).
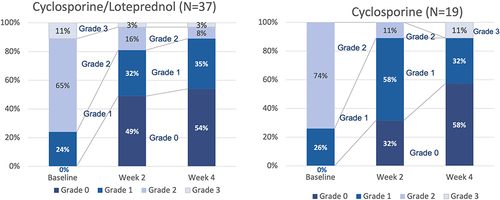
Table 4 Mean tear-breakup time (TBUT) compared to baseline had improved significantly at each follow-up visit
Figure 5 The proportion of patients with an abnormally low TBUT (<5 seconds) decreased in all groups. This change was statistically significant for cyclosporine/–loteprednol at both 2 and 4 weeks (P<0.003 and <0.0001, respectively, McNemar’s 2 test) and for cyclosporine at 4 weeks (P<0.01).
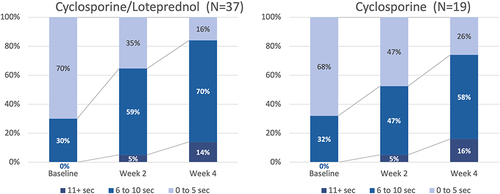
Table 5 Best-corrected visual acuity improved significantly between baseline and week 2 in patients taking CsA–LE, but not CsA alone, while no other differences were statistically significant
Figure 6 Conjunctival redness (Schulze scale) improved significantly in both groups.
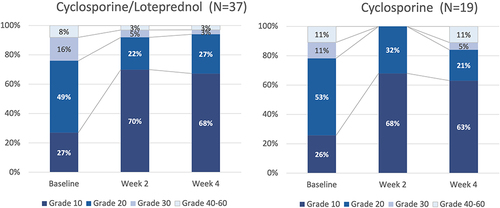
Figure 7 Frequency distribution of side effects of each medication.
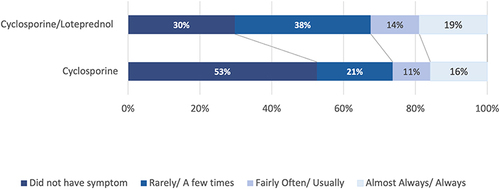
Figure 8 Frequency of all side effects queried in the validated COMTOL questionnaire.
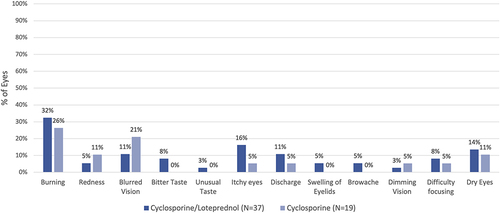
Table 6 IOP did not rise significantly in either group: abnormal pressure readings (>21 mmHg) were limited to a single patient (3%) in the combination drop group with an IOP of 30 MmHg at visit 3