Figures & data
Table 1 DEWS Scores by Treatment Duration with Cryopreserved Amniotic Membrane (cAM)
Figure 1 Corneal Staining Scores Following cAM Treatment. Corneal staining scores significantly improved from baseline at 1 week, 1 month, and 3 months for both the 2-day treatment group (n=10) and the overall study sample (n=89), with no significant differences observed between groups at any timepoint. **Denotes p<0.01 when compared to baseline.
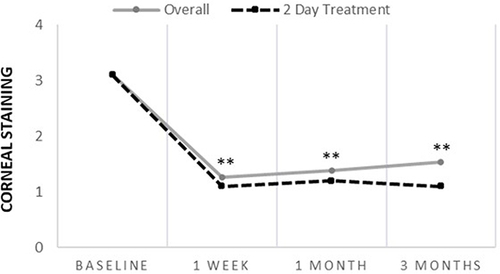
Figure 2 Ocular Discomfort Scores Following cAM Treatment. Ocular discomfort scores significantly improved from baseline at 1 week, 1 month, and 3 months post-treatment for both the 2-day treatment group (n=10) and the overall study sample (n=89), with no significant differences observed between groups at any timepoint. **Denotes p<0.01 when compared to baseline.
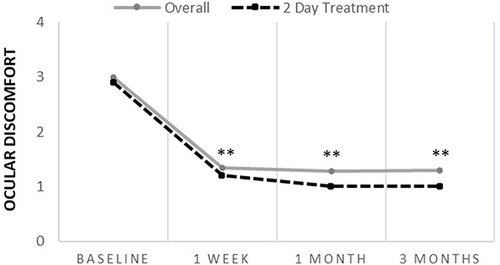
Figure 3 Visual Symptom Scores Following cAM Treatment. Visual symptom scores significantly improved from baseline at 1 week, 1 month, and 3 months post-treatment for both the 2-day treatment group (n=10) and the overall study sample (n=89), with no significant differences observed between groups at any timepoint. *Denotes p<0.05 when compared to baseline.
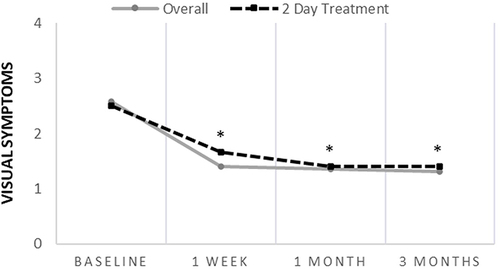
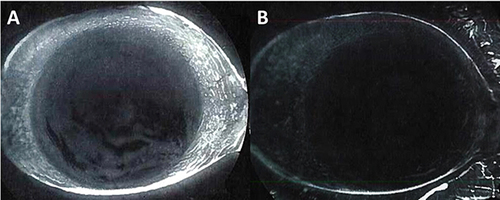
Figure 4 Representative Case. A 62-year-old male presented with moderate DED (DEWS 3) demonstrated by positive fluorescein staining (A). After 2 day treatment with cAM, the ocular surface healed with a stable tear film and clear cornea (B).