
Figures & data
Table 1 Profile of Participants
Table 2 Changes in IOP at Different Follow-Ups
Figure 1 Changes of IOP before and at different follow-ups between the two groups.
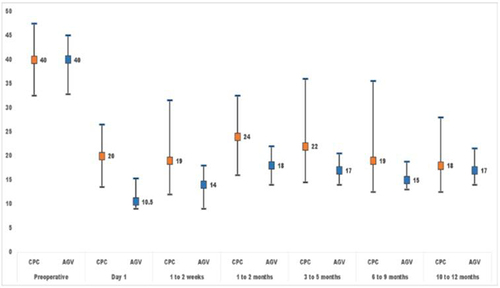
Table 3 Glaucoma Medications at Different Follow-Up in Two Groups
Figure 2 The survival probability of absolute success at different follow-ups between the two groups.
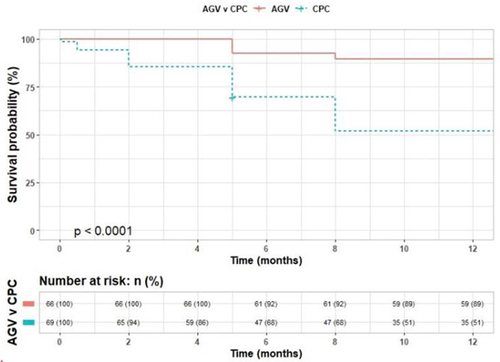
Table 4 Changes in Vision at Different Visits in CPC Vs AGV Group