Figures & data
Figure 1 The driving-related questions analysed in the study. Questions from the Visual Function-14 questionnaire are shown with a star (*). Questions 4 and 5 are the additional driving-related questions.
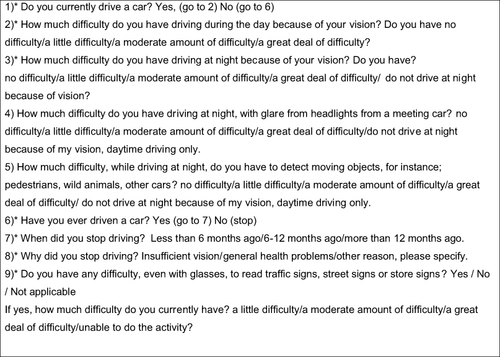
Table 1 Demographics and Visual Acuity of the Better-Seeing Eye by Driving Status
Figure 2 Longitudinal change in self-reported difficulties with daytime and nighttime driving, from before cataract surgery to 20 years after surgery, respectively. Mean score, 51 drivers.
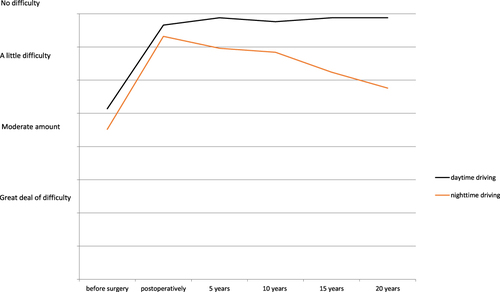
Figure 3 Longitudinal change in self-reported difficulties with glare and detection of low-contrast objects when driving at night, from 5 to 20 years after surgery. Mean score, 44 current nighttime drivers.
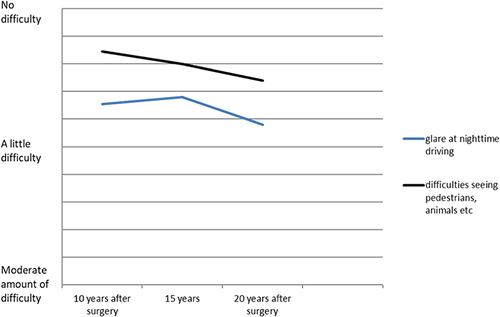
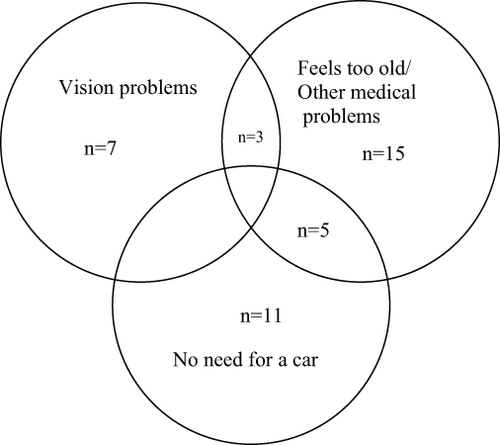
Figure 4 The most common reasons being a former driver.