Figures & data
Table 1 Demographic, Preoperative, and Postoperative Information for Dropless vs Conventional Cataract Surgery Groups
Figure 1 (A) Mean intraocular pressure (IOP) of all subjects at baseline, day 1, week 1, and week 4 after cataract surgery. (B) Mean IOP at baseline and postoperative weeks 1–24 in dropless vs conventional cataract surgery eyes with steroid response. The number of subjects in each group and at each timepoint is indicated below the diagram; “D” stands for dropless, “C” for conventional cataract surgery. *P<0.05, ***P<0.001. Error bars show standard error of the mean.
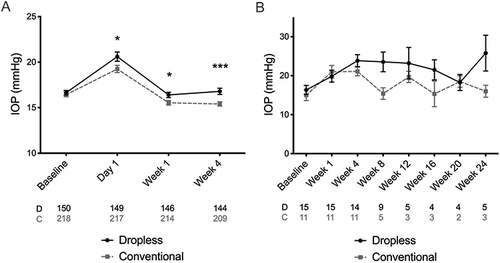
Table 2 Predictors of Steroid Response in All Eyes Undergoing Cataract Surgery (Univariate and Multivariate Analysis)
Table 3 Characteristics of Dropless vs Conventional Cataract Surgery Eyes That Developed Steroid Response
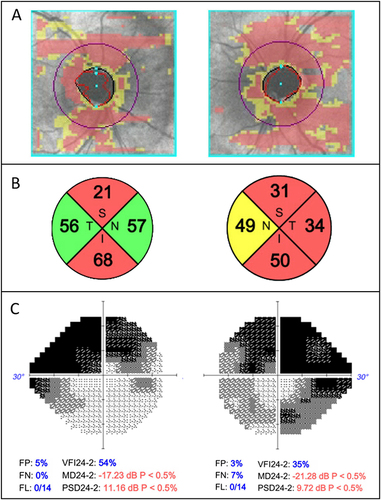
Figure 2 Optical Coherence Tomography and Humphrey Visual Field findings of a patient who developed severe glaucoma in the setting of prolonged steroid response following dropless cataract surgery. (A) Cirrus retinal nerve fiber layer (RNFL) Deviation Map for both eyes showing optic disc cupping and thinning of the peripapillary RNFL in both eyes. (B) RNFL thickness by quadrant showing superior and inferior thinning in the right eye and diffuse thinning in the left eye with mean RNFL thickness of 47 and 41 µm in the right and left eyes, respectively. (C) 24–2 SITA-Fast of right and left eyes showing significant arcuate defects in both eyes.