
Figures & data
Table 1 Baseline Demographics Overall and by Assigned Treatment in Primary Eye (ITT Population)
Table 2 Baseline Characteristics of Eyes (Primary and Contralateral) by Study Treatment (ITT Population)
Figure 1 Change in IOP from baseline in bimatoprost implant– and SLT-treated eyes. Data shown are least-squares means ± standard errors from a mixed-effects model for repeated measures. P values are for comparison of bimatoprost implant versus SLT.
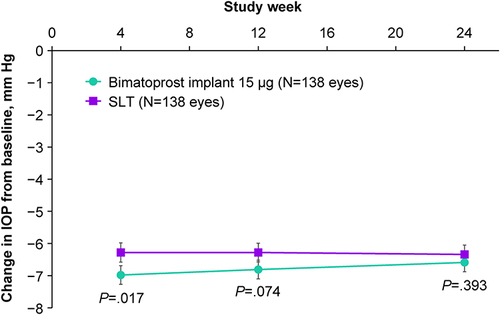
Figure 2 Kaplan−Meier analysis of time to first use of nonstudy (rescue) IOP-lowering treatment.
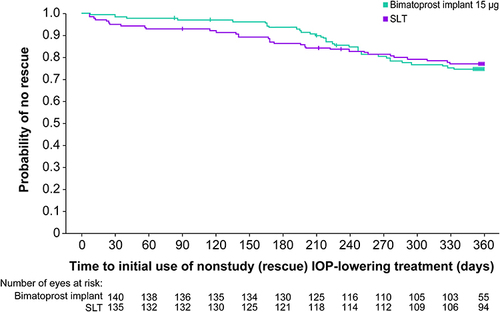
Figure 3 Proportion of eyes achieving at least a 20% decrease in IOP from baseline. Proportions were calculated using observed data for all eyes with IOP data available at baseline and the indicated visit.
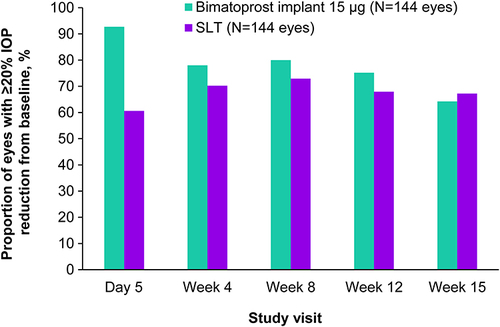
Table 3 Incidence of Ocular TEAEs (Safety Population)
Table 4 Corneal Endothelial Cell Density Findings on Specular Microscopy (Safety Population)