
Figures & data
Table 1 Recipient Demographics and Surgical Procedures in 162 Eyes from 120 Patients
Figure 1 Best spectacle corrected visual acuity (BSCVA) before and 1 month after DMEK (decimal), eyes without comorbidities.
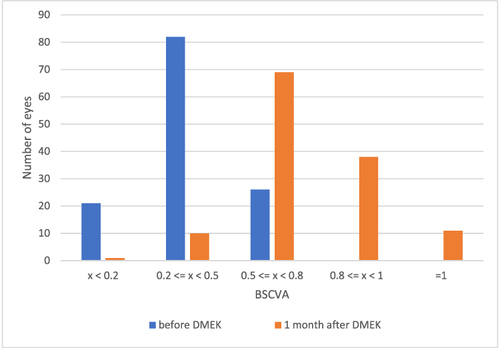
Figure 2 Best spectacle corrected visual acuity (BSCVA) before and 1 month after DMEK (decimal), eyes with comorbidities.
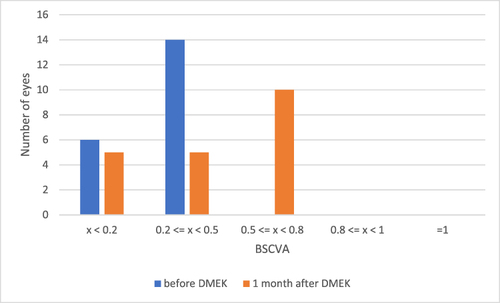
Table 2 Visual Acuity of 129 Eyes Without Comorbidities in logMAR; and Decimal Notation
Table 3 Visual Acuity of 20 Eyes with Comorbidities in logMAR; and Decimal Notation
Figure 3 Best spectacle corrected visual acuity (BSCVA) up to 6 years after DMEK (decimal): eyes without comorbidities.
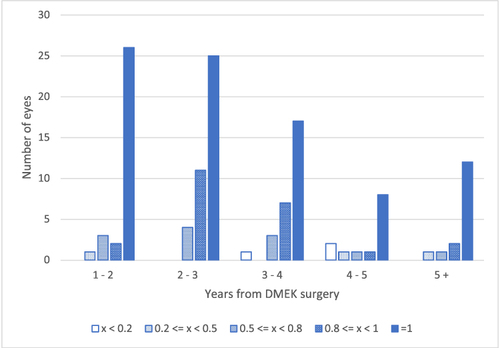
Figure 4 Best spectacle corrected visual acuity (BSCVA) up to 6 years after DMEK (decimal): eyes with comorbidities.
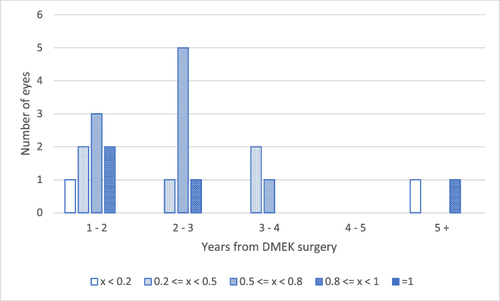
Table 4 Endothelial Cell Density (ECD) and Cell Loss – Cross-Sectional Analysis
Figure 5 Endothelial cell density loss. The boxes are drawn between the 25th and 75th percentiles. The horizontal lines show the median, while the whiskers indicate the minimum and maximum values.
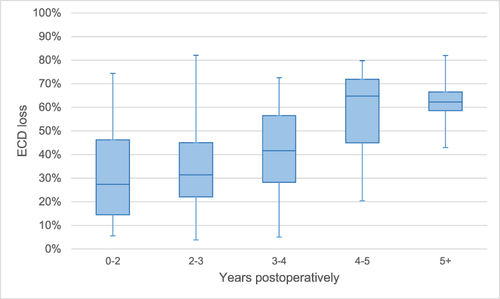
Table 5 Effects on Endothelial Cell Density (ECD)– Multiple Linear Regression