Figures & data
Table 1 Demographic Characteristics of Participants
Figure 1 Refraction outcomes: distribution of spherical equivalent prediction error (top) and refractive cylinder (bottom) at 4–6 months post-surgery.
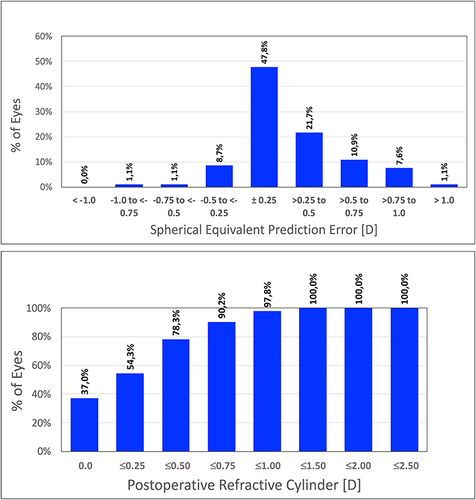
Figure 2 Vector analysis with preoperative and postoperative data. Centroids with standard deviations are also shown.
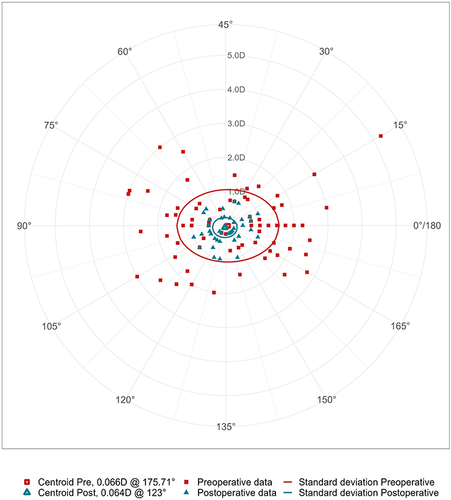
Figure 3 Difference between uncorrected-distance visual acuity (UDVA) and best corrected-distance visual acuity (CDVA) value at 4–6 months post-surgery for monocular and binocular conditions.
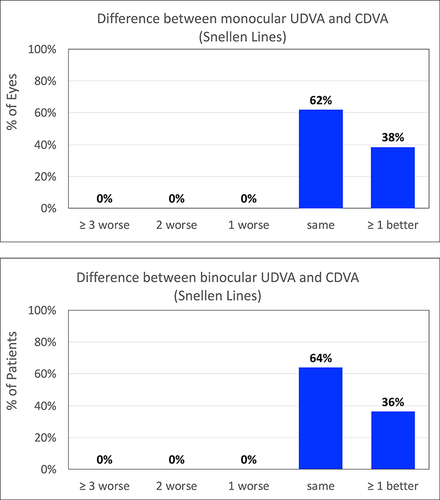
Figure 4 Cumulative proportion of eyes having a given photopic monocular and binocular logMAR uncorrected-distance visual acuity (UDVA) and best corrected-distance visual acuity (CDVA) value at 4–6 months post-surgery.
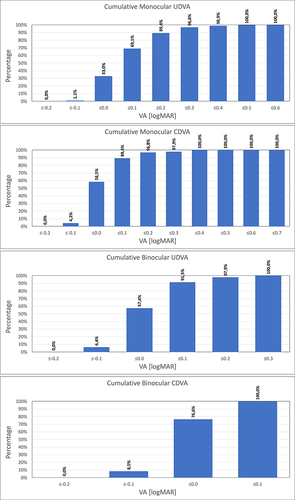
Figure 5 Cumulative proportion of eyes having a given mesopic monocular and binocular logMAR uncorrected-distance visual acuity (UDVA) and best corrected-distance visual acuity (CDVA) value at 4–6 months post-surgery.
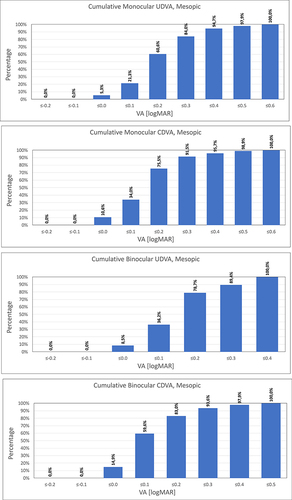
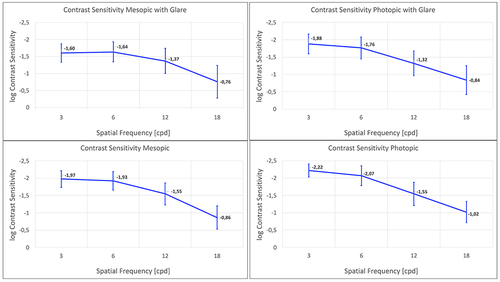
Figure 6 Mean photopic and mesopic binocular contrast sensitivity function with and without glare at 4–6 months post-surgery.