
Figures & data
Table 1 Preoperative and One-Month Postoperative Outcomes
Figure 1 Cumulative monocular (A) and binocular (B) uncorrected distance visual acuity. (VA – visual acuity).
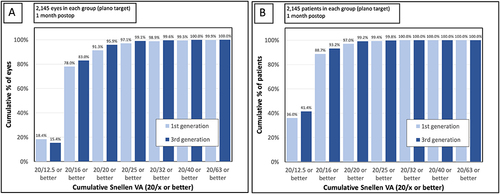
Figure 2 The difference between preoperative corrected distance visual acuity (CDVA) and postoperative uncorrected distance visual acuity (UDVA).
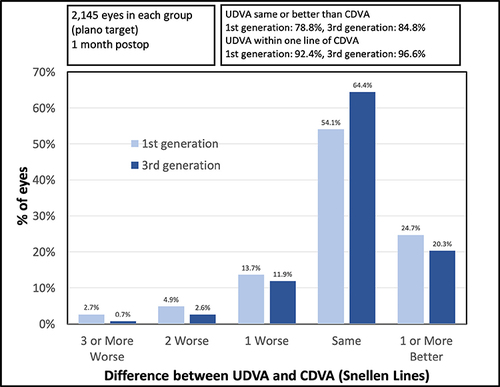
Figure 3 The difference between preoperative and postoperative corrected distance visual acuity (CDVA).
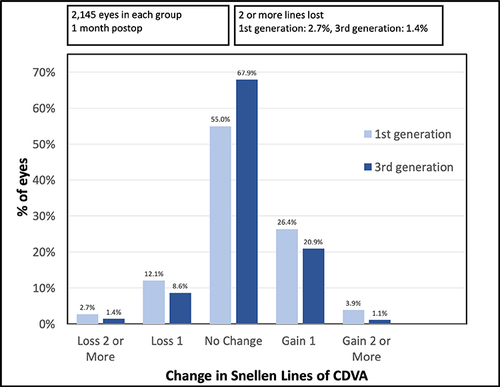
Figure 4 Attempted versus achieved correction of manifest spherical equivalent. (A) 1st generation treatment, (B) 3rd generation treatment.
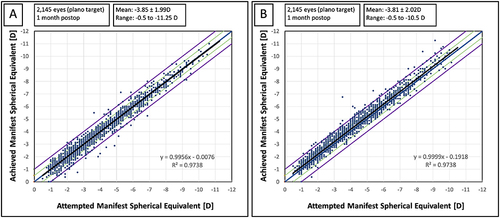
Figure 5 The distribution of postoperative manifest spherical equivalent (MSE).
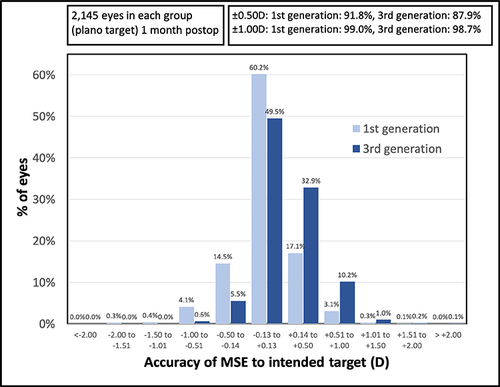
Figure 6 The distribution of postoperative residual refractive astigmatism (absolute values).
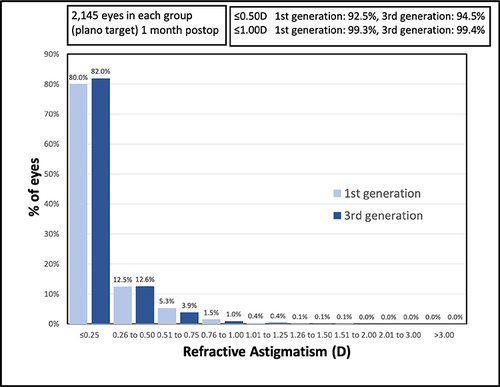
Figure 7 The scattergram of target induced (TIA) versus surgically induced (SIA) astigmatism vector. (A) 1st generation treatment, (B) 3rd generation treatment.
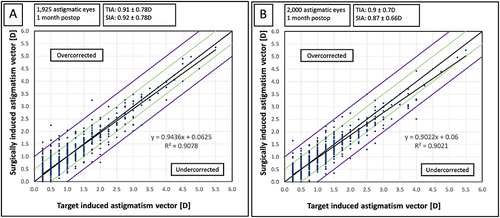
Figure 8 The distribution of angle of error (cc/wise – counterclockwise, c/wise – clockwise). (A) 1st generation treatment, (B) 3rd generation treatment.
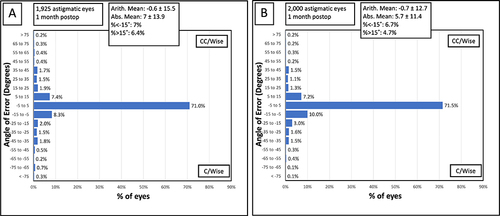
Table 2 Satisfaction and Visual Phenomena