
Figures & data
Table 1 The Original Sample Size of HM Patients and HCs
Table 2 Montreal Neurological Institute Coordinates for Region of Interest
Table 3 Demographic Characteristics of HM Patients and HCs
Table 4 Significant Differences in FC Values of the Left Hippocampus Between HM Patients and HCs
Table 5 Significant Differences in FC Values of the Right Hippocampus Between HM Patients and HCs
Figure 1 Spatial of distributions of FC patterns of the left hippocampus in HM patients and HCs.
Notes: (A) Mean FC values of left hippocampus in HM group; (B) mean FC values of left hippocampus in HC group; (C) different FC values of left hippocampus between two groups and (D) significant zFC maps of left hippocampus differences among two groups.
Abbreviations: HCs, healthy controls; HM, high myopia; FC, functional connectivity; zFC, z-values functional connectivity; L, left; R, right.
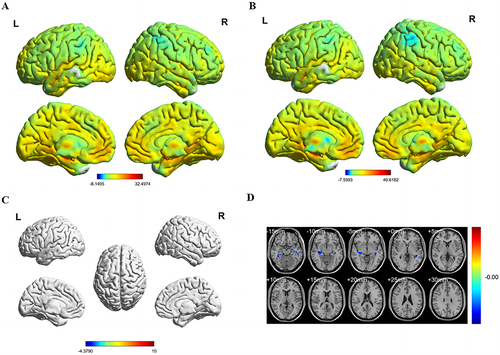
Figure 2 Spatial of distributions of FC patterns of the right hippocampus in HM patients and HCs.
Notes: (A) Mean FC values of right hippocampus in HM group; (B) mean FC values of right hippocampus in HC group; (C) different FC values of right hippocampus between two groups and (D) significant zFC maps of right hippocampus differences among two groups.
Abbreviations: HCs, healthy controls; HM, high myopia; FC, functional connectivity; zFC, z-values functional connectivity; L, left; R, right.
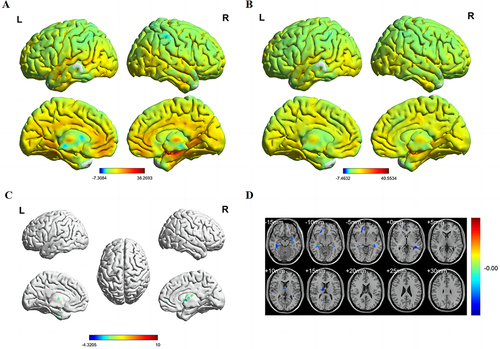
Table 6 Use of Seed-Based FC Technique for Analysis of Individuals with Ophthalmic or Other Systemic Diseases