Figures & data
Table 1 Demographics and Baseline Characteristics
Figure 1 Refractive and visual outcomes at Month 3.
Notes: (A) Cumulative postoperative UDVA compared with preoperative CDVA. (B) Line difference between postoperative UDVA and preoperative CDVA. A line is 0.1 logMAR. (C) Change in lines between preoperative and postoperative CDVA. (D) Attempted versus achieved spherical equivalent refraction. (E) Spherical equivalent refraction accuracy. (F) MRSE stability at screening, Week 1, Month 1, and Month 3. (G) Refractive astigmatism. (H) Target‑induced astigmatism versus surgically induced astigmatism. (I) Refractive astigmatism angle of error. For panels showing the proportion of eyes, for clarity, numbers ≥1 are displayed as integers and those <1 are shown to 1 decimal place, and in all cases, the total is 100%.
Abbreviations: Abs, absolute; Arith, arithmetic; CDVA, corrected distance visual acuity; C/Wise, clockwise; CC/Wise, counterclockwise; D, diopter; logMAR, logarithm of the minimum angle of resolution; mo, month; MRSE, manifest refraction spherical equivalent; postop, postoperative; preop, preoperative; SD, standard deviation; SEQ, spherical equivalent refraction; SIA, surgically induced astigmatism; TIA, target-induced astigmatism; UDVA, uncorrected distance visual acuity; VA, visual acuity; wk, week.
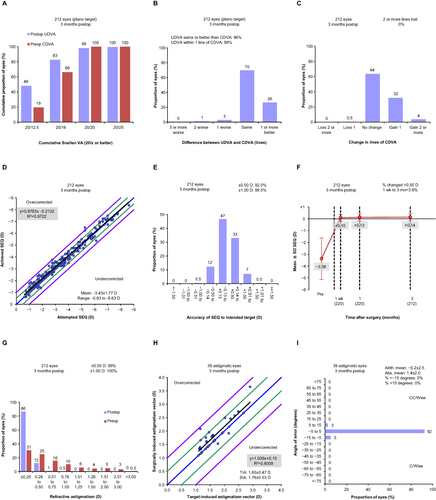
Figure 2 Astigmatism vector analyses at Month 3.
Notes: Vector analyses of (A) target-induced astigmatism, (B) surgically induced astigmatism, (C) difference vector, and (D) correction index.
Abbreviations: Arith, arithmetic; Ax, axis; cyl, cylinder; D, diopter; Geom, geometric; SD, standard deviation; +ve, positive.
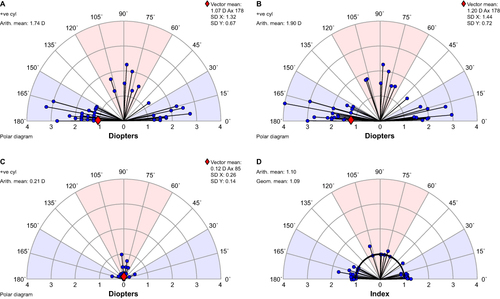
Table 2 Higher-Order Aberrations
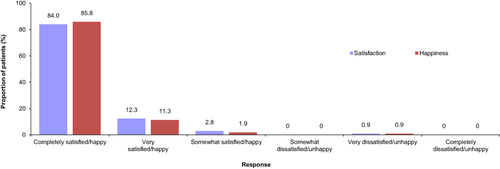
Figure 3 Patient satisfaction at Month 3.
Notes: Detailed responses from the PROWL questionnaire on current satisfaction with results of Femto LASIK surgery and happiness/unhappiness that they had Femto LASIK surgery (n=106 patients).
Abbreviations: Femto LASIK, femtosecond-assisted LASIK; LASIK, laser-assisted in situ keratomileusis; PROWL, patient-reported outcomes with LASIK.