Figures & data
Figure 1 SD-OCT characteristics of different stages of PAMM lesions in APAC or APACG eyes. Stage I (edema): hyper-reflective lesions involving the INL (white arrow) along with the shadowing effect they created (black arrow) and some lesions extended into IPL and OPL. Stage II (edema resolution): severe attenuating OPL thickness (white arrow) along with the corresponding shadow partially resolved. Stage III (atrophy): a legacy of INL thinning and irregular, attenuated OPL (white arrow) along with hyper-reflective lesions resolved.
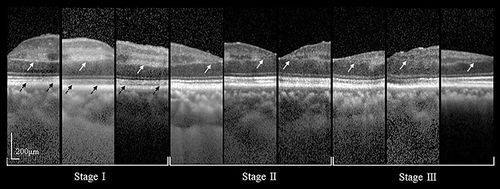
Table 1 Demographic Characteristics and Ocular Findings of Patients with APAC or APACG (N = 781)
Table 2 Systemic Associations of Patients with APAC or APACG (N = 781)
Table 3 BCVA Comparison Between the Three Stages
Figure 2 Boxplots showing the distribution of PAMM patients’ time from symptoms to treatment (TST, days) for the three stages. Whiskers mean values from minimum to maximum. ** P < 0.01. Stage I: edema, Stage II: edema resolution, Stage III: atrophy.
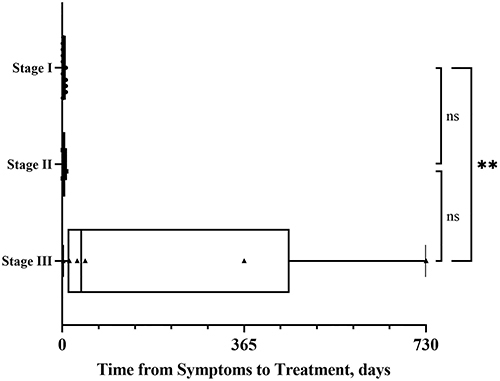
Figure 3 Bar charts showing the PAMM group patients’ characteristics. Error bars are standard deviations. (A) Inner retinal thickness among the three stages. (B) Full retinal thickness among the three stages. (C) The highest recorded IOP among the three stages. (D) BCVA improvement from baseline at final visit, lines. ** P < 0.01, *** P < 0.001, **** P < 0.0001. Stage I: edema, Stage II: edema resolution, Stage III: atrophy.
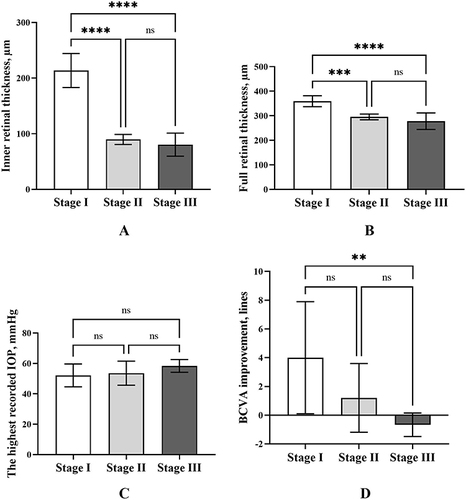
Table 4 The Pearson or Spearman Correlations Between BCVA and Other Factors in PAMM Eyes
Figure 4 A female ages 65–75 years old with hypertension presented with acute vision loss and periocular pain in the right eye. Visual acuity was no light perception (logMAR equivalent, 3.0) at presentation, and the IOP was 63 mmHg; SD-OCT displayed the development of PAMM lesions in an APACG patient. (A) Distinct hyper-reflective lesions at INL extended into IPL and OPL (stage I, edema); (B) Distinct attenuating OPL thickness (stage II, edema resolution); (C) Severe INL thinning (stage III, atrophy). The white / black arrow represents the full / inner retinal thickness (µm) at the thickest part of stage I lesion and the thinnest part of stage II or III lesions.
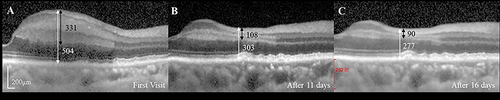
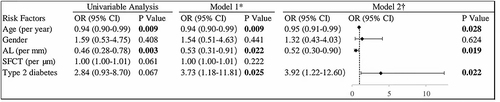
Figure 5 Univariable and multivariable binary logistic regression of factors associated with PAMM following APAC or APACG.