Figures & data
Figure 1 Kaplan–Meier survival curve for corneal graft following penetrating keratoplasty. The overall survival time was 88.9 months ± 4.9 months (mean ± standard error of mean, 95% confidence interval 79.4 months –98.4 months).
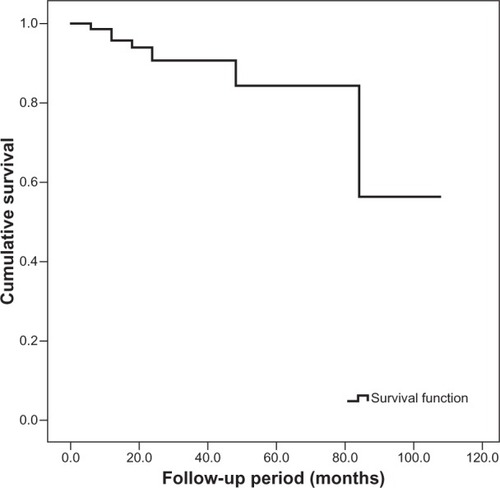
Table 1 Univariate analysis of graft failure association (P < 0.05 indicates statistical significance)
Figure 2 Kaplan–Meier survival curves for (A) rejection (log-rank test, λ2 = 31.13, P < 0.001) and (B) vascularization (log-rank test, λ2 = 4.57, P = 0.033).
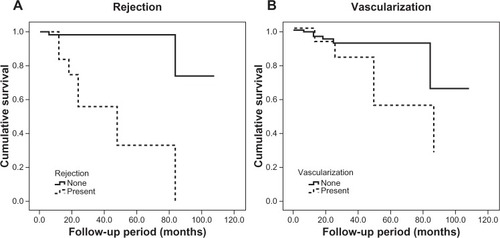
Table 2 Comparison of corneal graft survival time between strata in rejection, vascularization, and surgical indication factors (P < 0.05 indicates statistical significance)
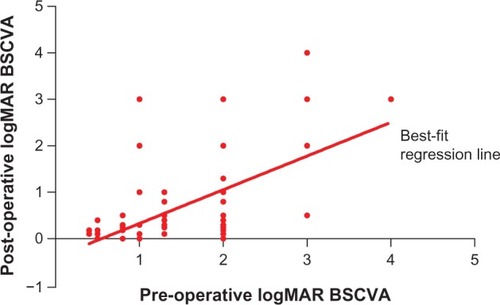
Figure 3 Distribution of eyes according to the pre-operative and post-operative logarithm of minimum angle of resolution (logMAR) best spectacle-corrected visual acuity (BSCVA) (slope = 0.73±0.12, 95% confidence interval 0.48-0.97).