
Figures & data
Table 1 Comparison of Parameters Among the Keratoconus (KC), Forme Fruste Keratoconus (FFKC), and Normal Cornea (NL) Groups
Table 2 Receiver Operator Characteristic (ROC) Curve Analysis Results for Different Parameters in Distinguishing the Keratoconus (KC) and Forme Fruste Keratoconus (FFKC) Groups from the Normal Cornea (NL) Group
Table 3 Top Five Parameters with the Highest AUC Values Distinguishing the Forme Fruste Keratoconus (FFKC) Group from the Normal Cornea (NL) Group
Figure 1 Receiver operating characteristic curve for distinguishing keratoconus from normal corneas.
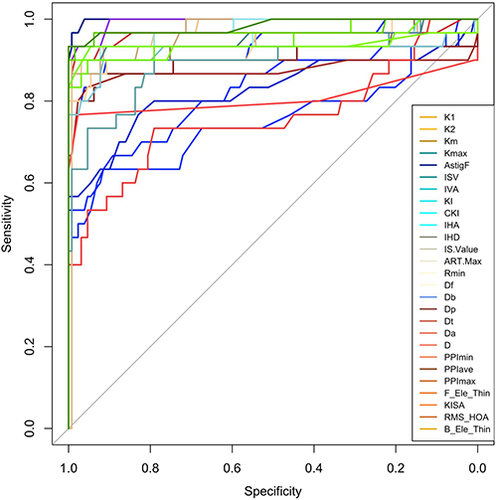
Figure 2 Receiver operating characteristic curve for distinguishing forme fruste keratoconus from normal corneas.
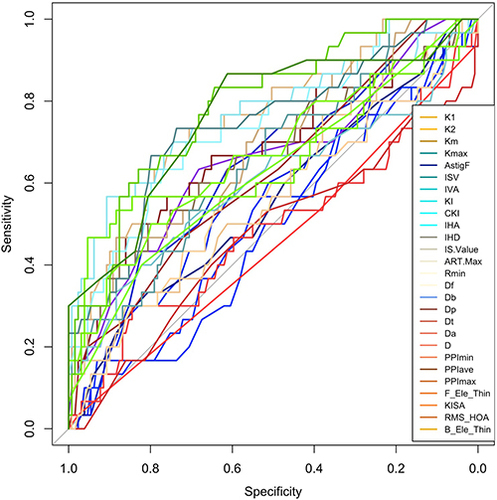
Table 4 Comparison of the Receiver Operator Characteristic (ROC) Curves of Some Parameters in the Keratoconus (KC), Forme Fruste Keratoconus (FFKC), and the Normal Cornea (NL) Groups