Figures & data
Figure 1 Image of the FineVision (PhysIOL, Liège, Belgium) intraocular lens.
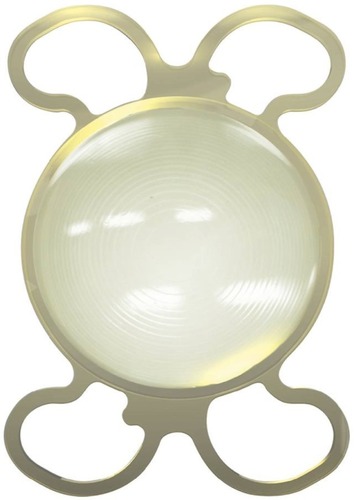
Table 1 List of questions addressed to the patients 1 to 2 months after surgery
Table 2 Preoperative patient data
Table 3 Monocular visual acuity scores
Table 4 Binocular visual acuity scores
Figure 2 Distribution of the spherical equivalent: percentage of eyes with respect to the achieved spherical equivalent.
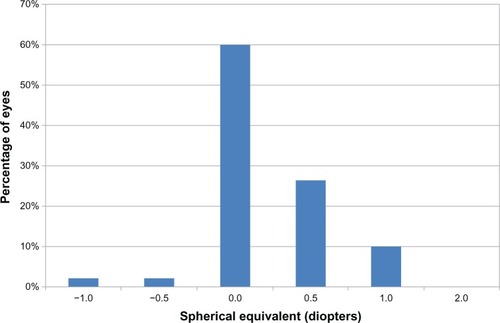
Figure 3 Average binocular defocus curve with distance correction.
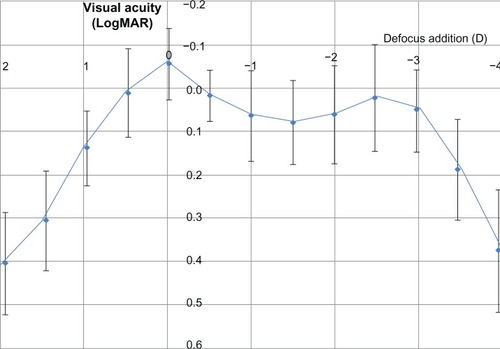
Figure 4 Monocular contrast sensitivity outcomes with CVS-1000 (VectorVision, Greenville, SC, USA) in photopic and mesopic conditions.
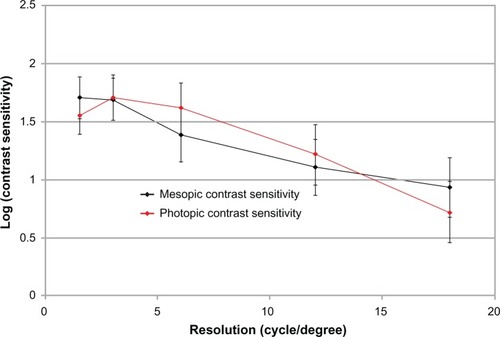
Figure 5 Scores obtained from the questionnaire addressed to the patients 1 to 2 months after surgery.
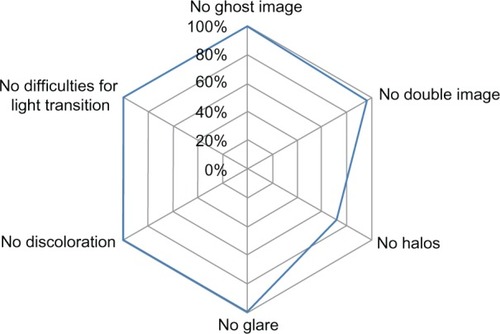
Table 5 Mean logarithm of the contrast sensitivity in different publications for several multifocal IOLs