Figures & data
Table 1 Number and Property of Meshes Used for FEA Model
Figure 1 Frontal (A) and sagittal (B) view of model eye of emmetropia.
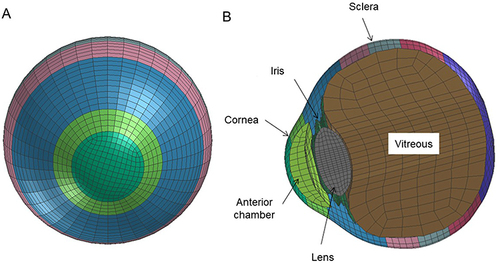
Table 2 Length or Thickness of Intraocular Segments in Axial Direction at Baseline of Three Axial Length Eye Models
Figure 2 Sequential deformity of hyperopic eye upon airbag impact at five different velocities. Cases of impact velocities of 20 (A), 30 (B), 40 (C), 50 (D), and 60 m/s (E) in the normal-length model eye are shown. Results at 0, 0.2, 0.8, 1.4 and 2.0 ms after the impact are displayed. Axial deviation from the baseline position is displayed in each figure on a color-bar scale.
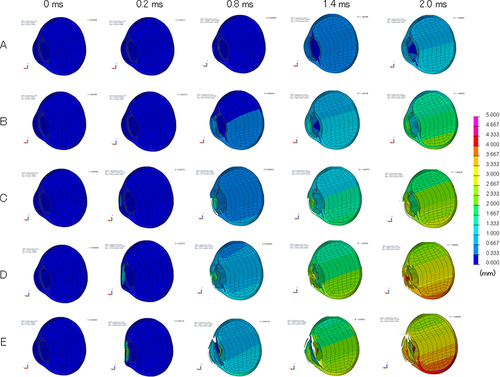
Figure 3 Sequential deformity of emmetropic eye upon airbag impact at five different velocities. Cases of impact velocities of 20 (A), 30 (B), 40 (C), 50 (D), and 60 m/s (E) in the normal-length model eye are shown. Results at 0, 0.2, 0.8, 1.4 and 2.0 ms after the impact are displayed. Axial deviation from the baseline position is displayed in each figure on a color-bar scale.
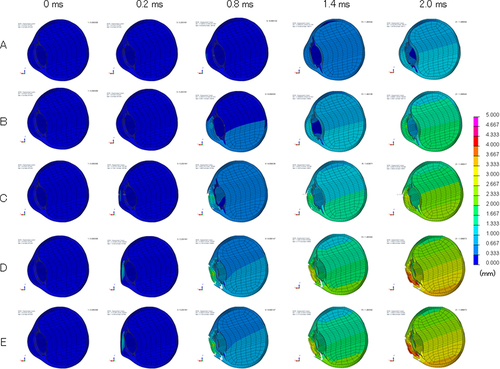
Figure 4 Sequential deformity of myopic eye upon airbag impact at five different velocities. Cases of impact velocities of 20 (A), 30 (B), 40 (C), 50 (D), and 60 m/s (E) in the normal-length model eye are shown. Results at 0, 0.2, 0.8, 1.4 and 2.0 ms after the impact are displayed. Axial deviation from the baseline position is displayed in each figure on a color-bar scale.
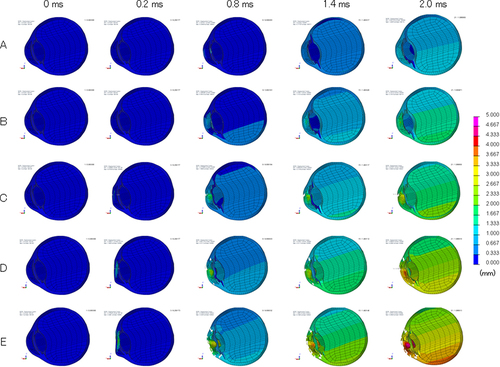
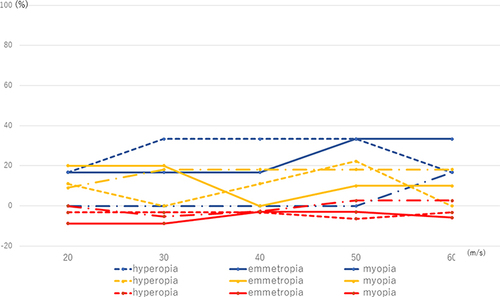
Figure 5 Deformation rate of anterior chamber, lens and vitreous for eyes with three axial lengths at 0.2 ms after airbag impact at five impact velocities. Deformation rates of the anterior chamber, lens, and vitreous are represented by blue, yellow and red lines, respectively. Solid, dashed, and dash-dotted lines represent the deformation rates of emmetropia, hyperopia, and myopia, respectively.
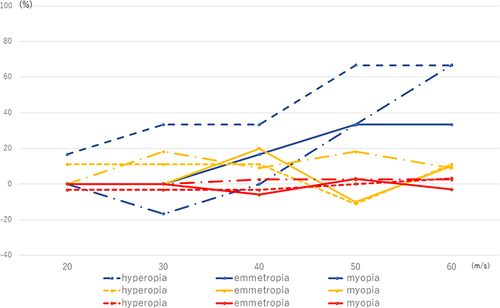
Figure 6 Deformation rate of anterior chamber, lens and vitreous for eyes with three axial lengths at 0.4 ms after airbag impact at five impact velocities. Legends pertaining to the line drawings are the same as in .
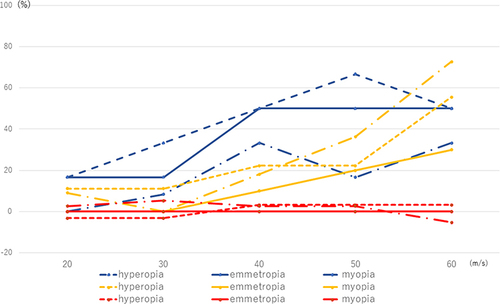
Figure 7 Deformation rate of anterior chamber, lens and vitreous for eyes with three axial lengths at 0.6 ms after airbag impact at five impact velocities. Legends pertaining to the line drawings are the same as in .
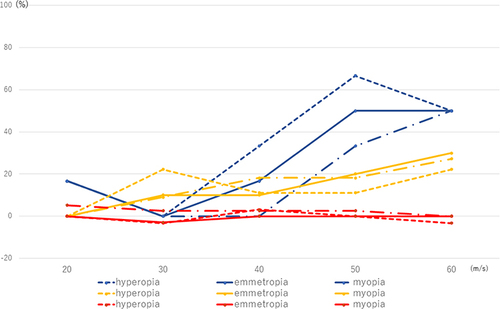
Figure 8 Deformation rate of anterior chamber, lens and vitreous for eyes with three axial lengths at 0.8 ms after airbag impact at five impact velocities. Legends pertaining to the line drawings are the same as in .
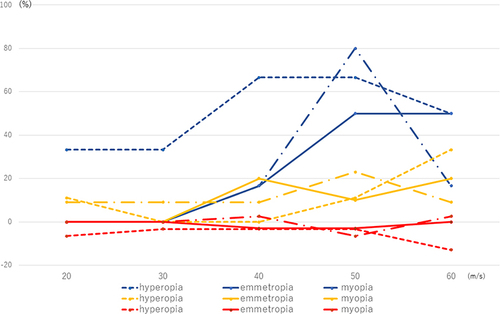
Figure 9 Deformation rate of anterior chamber, lens and vitreous for eyes with three axial lengths at 1.0 ms after airbag impact at five impact velocities. Legends pertaining to the line drawings are the same as in .
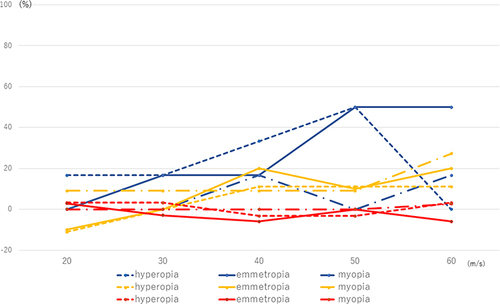
Figure 10 Deformation rate of anterior chamber, lens and vitreous for eyes with three axial lengths at 1.2 ms after airbag impact at five impact velocities. Legends pertaining to the line drawings are the same as in .
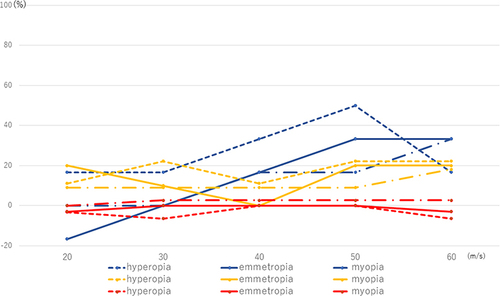
Figure 11 Deformation rate of anterior chamber, lens and vitreous for eyes with three axial lengths at 1.4 ms after airbag impact at five impact velocities. Legends pertaining to the line drawings are the same as in .
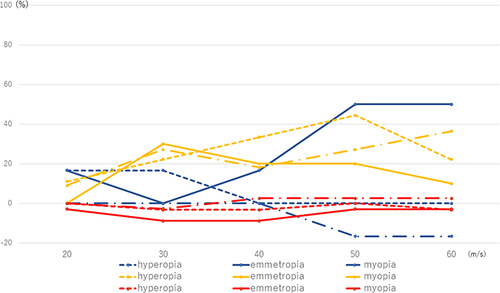
Figure 12 Deformation rate of anterior chamber, lens and vitreous for eyes with three axial lengths at 1.6 ms after airbag impact at five impact velocities. Legends pertaining to the line drawings are the same as in .
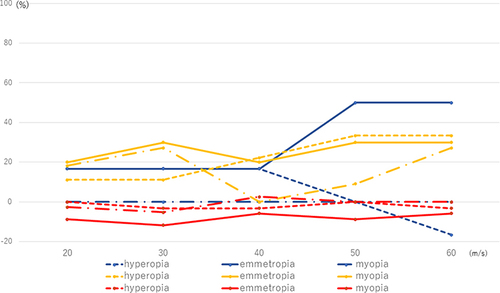
Figure 13 Deformation rate of anterior chamber, lens and vitreous for eyes with three axial lengths at 1.8 ms after airbag impact at five impact velocities. Legends pertaining to the line drawings are the same as in .
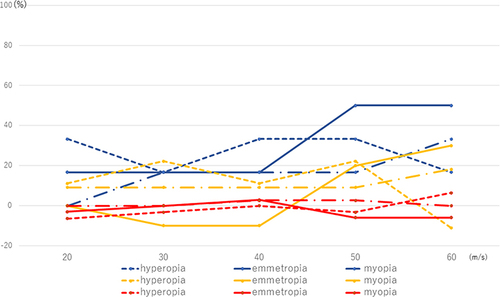
Figure 14 Deformation rate of anterior chamber, lens and vitreous for eyes with three axial lengths at 2.0 ms after airbag impact at five impact velocities. Legends pertaining to the line drawings are the same as in .