Figures & data
Figure 1 AT ELANA 841P single-piece trifocal IOL (Carl Zeiss Meditec) with a C-loop haptic configuration and diffractive-refractive design.
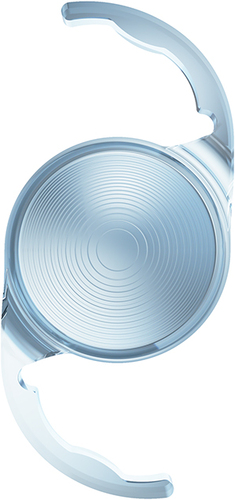
Figure 2 MTF levels at the best focus (far, intermediate, and near). The dotted lines show the values of each sample separately; the solid lines refer to their average. Blue lines represent Condition 1 (+0.27-µm SA cornea, polychromatic light), green represents Condition 2 (+0.27-µm SA cornea, monochromatic light), and red represents Condition 3 (SA-neutral cornea, monochromatic light).
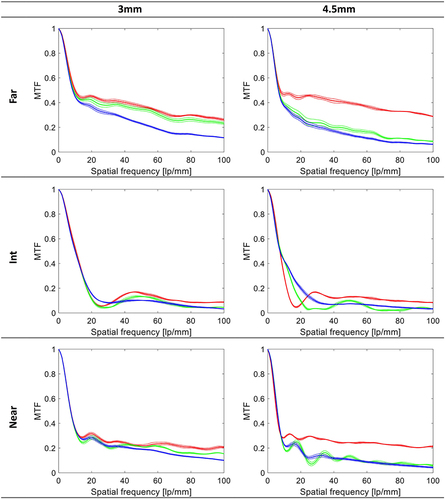
Figure 3 Through-focus MTF curves measured at three spatial frequencies. The dotted lines show the values of each sample separately; the solid lines refer to their average. Blue lines represent Condition 1 (+0.27-µm SA cornea, polychromatic light), green represents Condition 2 (+0.27-µm SA cornea, monochromatic light), and red represents Condition 3 (SA-neutral cornea, monochromatic light).
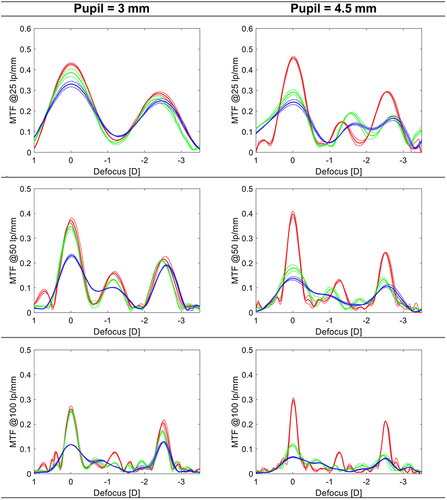
Figure 4 The area under the MTF curve and simulated visual acuity (VA) measured at the defocus range from +1 D to −3.5 D at the spectacle plane. The dotted lines show the values of each sample separately; the solid lines refer to their average. Blue lines represent Condition 1 (+0.27-µm SA cornea, polychromatic light), green represents Condition 2 (+0.27-µm SA cornea, monochromatic light), and red represents Condition 3 (SA-neutral cornea, monochromatic light).
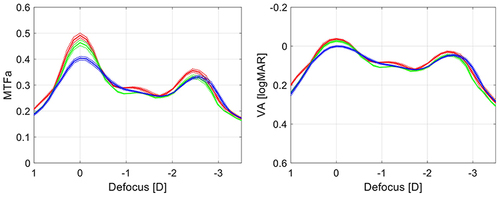
Figure 5 USAF target images recorded at a defocus range of +1.0 D to −3.5 D at a 3-mm aperture. Condition 1 = +0.27-µm SA cornea and polychromatic light; Condition 2 = +0.27-µm SA cornea and monochromatic light; Condition 3 = SA-neutral cornea and monochromatic light.
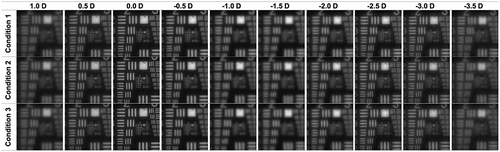
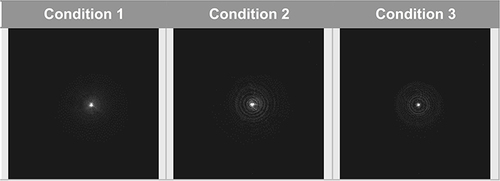
Figure 6 The visualization of the low-intensity light distribution produced by a 0.1-mm pinhole was recorded through a 4.5-mm pupil. Condition 1 = +0.27-µm SA cornea and polychromatic light; Condition 2 = +0.27-µm SA cornea and monochromatic light; Condition 3 = SA-neutral cornea and monochromatic light.