Figures & data
Figure 1 Shows the flowchart and study inclusion in this review.
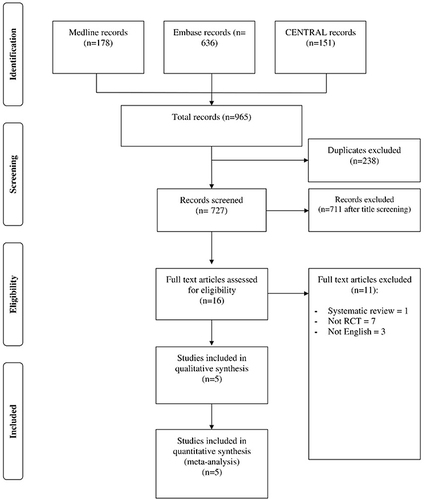
Figure 2 (A) Risk of bias graph (B) Risk of bias summary: review authors’ judgements about each risk of bias item presented as percentages across all included studies.
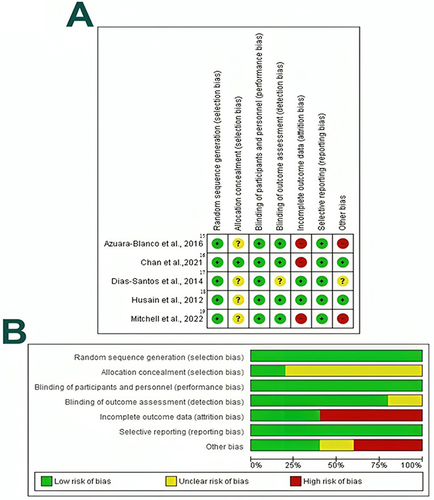
Figure 3 Forest plot of summary analysis of the Mean Difference (MD) and 95% CI of mean change from baseline of the intraocular pressure between the phacoemulsification and laser peripheral iridotomy groups. Size of the green squares is proportional to the statistical weight of each trial. The grey diamond represents the pooled point estimate. The positioning of both diamonds and squares (along with 95% CIs) beyond the vertical line (unit value) suggests a significant outcome (IV = inverse variance).
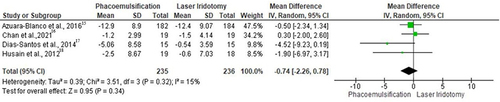
Figure 4 Forest plot of summary analysis of the Mean Difference (MD) and 95% CI of mean change from baseline of the medications usage between the phacoemulsification and laser peripheral iridotomy groups. Size of the green squares is proportional to the statistical weight of each trial. The grey diamond represents the pooled point estimate. The positioning of both diamonds and squares (along with 95% CIs) beyond the vertical line (unit value) suggests a significant outcome (IV = inverse variance).
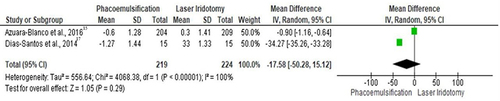
Figure 5 Forest plot of summary analysis of the Standardized Mean Difference (SMD) and 95% CI of the mean score of visual field between the phacoemulsification and laser peripheral iridotomy groups. Size of the green squares is proportional to the statistical weight of each trial. The grey diamond represents the pooled point estimate. The positioning of both diamonds and squares (along with 95% CIs) beyond the vertical line (unit value) suggests a significant outcome (IV = inverse variance).
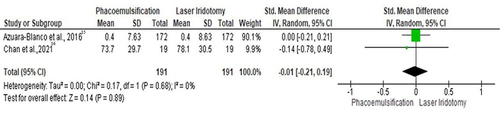
Figure 6 Forest plot of summary analysis of the Standardized Mean Difference (SMD) and 95% CI of the mean score of visual acuity between the phacoemulsification and laser peripheral iridotomy groups. Size of the green squares is proportional to the statistical weight of each trial. The grey diamond represents the pooled point estimate. The positioning of both diamonds and squares (along with 95% CIs) beyond the vertical line (unit value) suggests a significant outcome (IV = inverse variance).
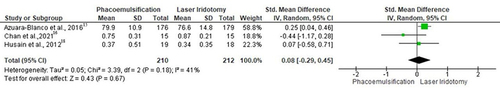
Figure 7 Forest plot of summary analysis of the Standardized Mean Difference (SMD) and 95% CI of the mean central corneal thickness between the phacoemulsification and laser peripheral iridotomy groups. Size of the green squares is proportional to the statistical weight of each trial. The grey diamond represents the pooled point estimate. The positioning of both diamonds and squares (along with 95% CIs) beyond the vertical line (unit value) suggests a significant outcome (IV = inverse variance).
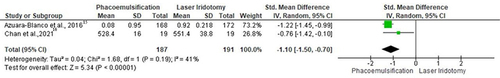
Figure 8 Forest plot of summary analysis of the Mean Difference (MD) and 95% CI of the mean central endothelial cell density between the phacoemulsification and laser peripheral iridotomy groups. Size of the green squares is proportional to the statistical weight of each trial. The grey diamond represents the pooled point estimate. The positioning of both diamonds and squares (along with 95% CIs) beyond the vertical line (unit value) suggests a significant outcome (IV = inverse variance).
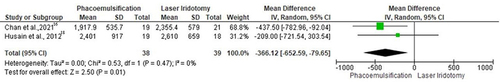
Figure 9 Forest plot of summary analysis of the Standardized Mean Difference (SMD) and 95% CI of the mean peripheral anterior synechiae between the phacoemulsification and laser peripheral iridotomy groups. Size of the green squares is proportional to the statistical weight of each trial. The grey diamond represents the pooled point estimate. The positioning of both diamonds and squares (along with 95% CIs) beyond the vertical line (unit value) suggests a significant outcome (IV = inverse variance).
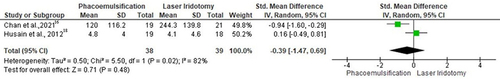
Figure 10 Forest plot of summary analysis of the Mean Difference (MD) and 95% CI of the mean Shaffer gonioscopy grading between the phacoemulsification and laser peripheral iridotomy groups. Size of the green squares is proportional to the statistical weight of each trial. The grey diamond represents the pooled point estimate. The positioning of both diamonds and squares (along with 95% CIs) beyond the vertical line (unit value) suggests a significant outcome (IV = inverse variance).
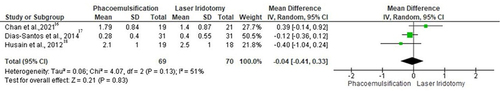
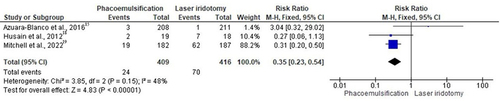
Figure 11 Forest plot of summary analysis of the risk ratio (RR) and 95% CI of the risk of poor response to surgery between the phacoemulsification and laser peripheral iridotomy groups. Size of the blue squares is proportional to the statistical weight of each trial. The grey diamond represents the pooled point estimate. The positioning of both diamonds and squares (along with 95% CIs) beyond the vertical line (unit value) suggests a significant outcome (IV = inverse variance).