Figures & data
Figure 1 Baseline tear cytokine concentrations (mean ± standard deviation) of subjects who used RNF in Phase I or OFR in Phase I.
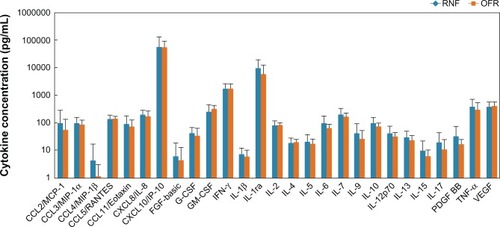
Figure 2 Tear levels of representative cytokines of subjects using different MPS in Phase I and Phase II.
Abbreviations: INF, interferon; IL, interleukin; MPS, multipurpose solution; OFR, Opti-Free RepleniSH; RNF, ReNu Fresh.
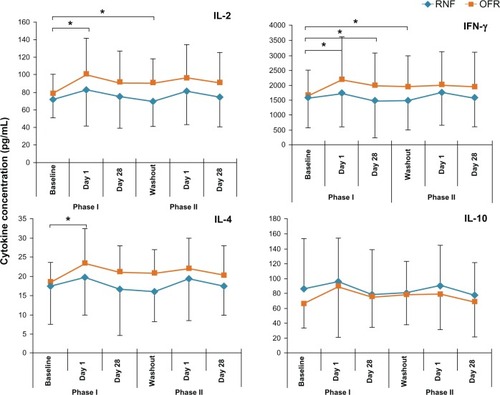
Table 1 Statistical analysis of tear cytokine concentration changes from baseline
Table 2 Conjunctival surface hyperemia score (mean ± standard deviation, scale 0–100)
Figure 3 Ocular surface sensitivity thresholds of subjects using different MPS in Phase I and Phase II.
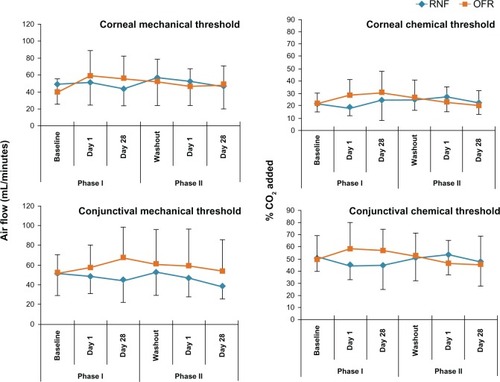
Table 3 Corneal surface chemical and mechanical sensitivity
Table 4 Corneal surface staining score (mean ± standard deviation), severity scale 0–4, extent scale (0%–100%)
Figure 4 Subjective responses of subjects using different MPS in Phase I and Phase II.
Abbreviations: AM, morning; AN, afternoon; MPS, multipurpose solution; PM, evening; OFR, Opti-Free RepleniSH; RNF, ReNu Fresh.
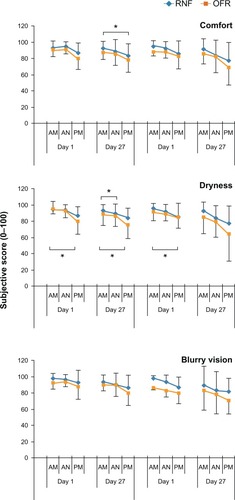
Table 5 Statistical analysis of subjective symptom score changes from morning score; P-value by paired t-test
Table 6 Scores for stinging or burning upon CL/MPS insertion (mean ± standard devation), scale 0 (severe) to 100 (negligible)