
Figures & data
Table 1 Order of Examinations and Description of Tests
Table 2 Demography
Table 3 Variability for the Groups SDE+ and SDE
Figure 1 Variability in average K compared between the groups SDE+ (group A) and SDE- (group B) for three optical biometers.
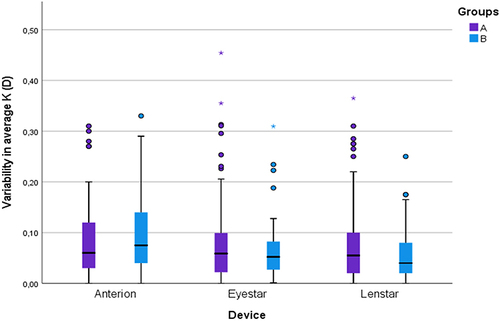
Figure 2 Variability of vector astigmatism between the groups SDE+ (group A) and SDE- (group B) for three optical biometers.
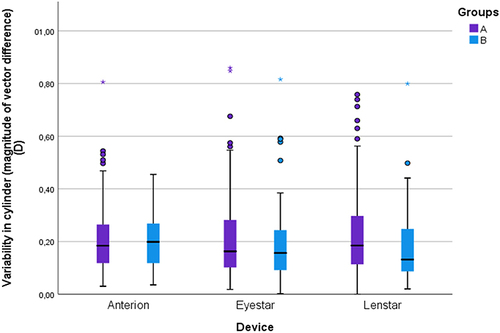
Table 4 Variability for the Groups Hyperosmolar (DEWS II) and Hyperosmolar (Study Eye)
Figure 3 Percentages of eyes with variability of astigmatism greater than 0.25 D for hyperosmolar and normal eyes.
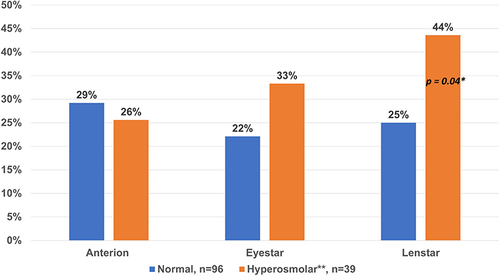
Table 5 Variability for the Group NIKBUT Positive
Figure 4 Percentages of eyes with average K greater than 0.25 D with NIKBUT+ and NIKBUT- (normal eyes).
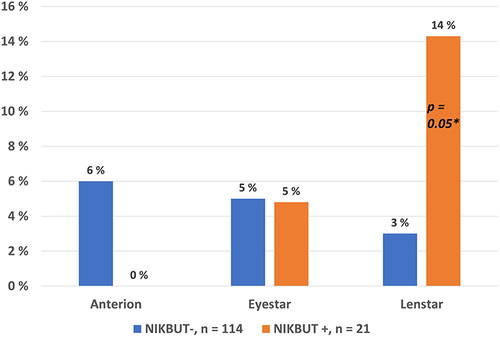
Table 6 Variability for the Groups OSS Positive (1) and OSS Positive (2)