Figures & data
Figure 1 Treatment protocol. Intervention schedule for patients with age-related macular degeneration treated with faricimab. We administered three, monthly injections of 6 mg faricimab, and evaluated the efficacy two months after the third injection (month 4). Clinical data were collected at baseline and month 4. ×, Faricimab injection (6 mg); 〇, clinical data collection; □, efficacy endpoint.
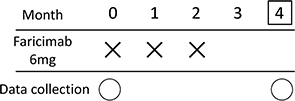
Table 1 Baseline Demographic and Clinical Characteristics of Patients with Neovascular Age-Related Macular Degeneration
Figure 2 Visual and anatomic outcome of age-related macular degeneration (AMD) eyes treated with faricimab. (A and B) Changes in the logarithm of minimum angle resolution (logMAR) visual acuity (VA) in total eyes (A), and typical age-related macular degeneration (tAMD) and polypoidal choroidal vasculopathy (PCV) eyes (B). (C–F) Changes in central retinal thickness (CRT) (C), subfoveal choroidal thickness (SFCT) (D), maximum pigment epithelial detachments (PED) height (E), and maximum subretinal hyperreflective material (SHRM) height (F) in total eyes. *P < 0.05, **P < 0.005, ***P < 0.001 compared between two groups (A and C–F), and between baseline and month 4 (B).
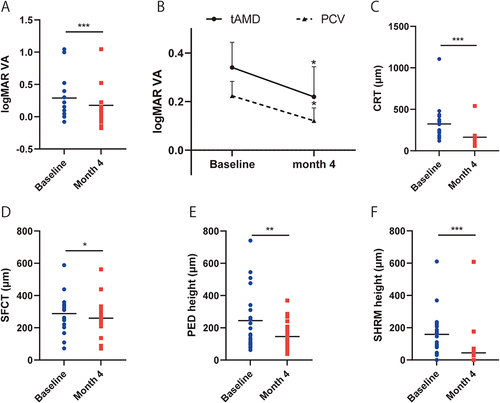
Table 2 Comparison of Baseline Characteristics Between Neovascular AMD Patients with and without Pachychoroid Phenotypse
Figure 3 Comparison of visual and anatomic outcome between age-related macular degeneration (AMD) with and without pachychoroid phenotypes. Changes in the logarithm of minimum angle resolution (logMAR) visual acuity (VA) (A), subfoveal choroidal thickness (SFCT) (B), central retinal thickness (CRT) (C), maximum pigment epithelial detachments (PED) height (D), and maximum subretinal hyperreflective material (SHRM) height (E) in age-related macular degeneration (AMD) with and without pachychoroid phenotypes. *P < 0.05, **P < 0.005, ***P < 0.001 compared between baseline and month 4 (A–E), and †P < 0.05 compared between eyes with and without pachychoroid phenotypes (C).
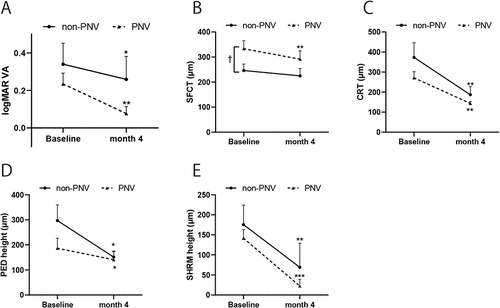
Table 3 Predictive Factors of Visual Acuity at Month 4 in Patients with Faricimab
Table 4 Results of Multiple Linear Regression After Step-Wise Selection in Patients Treated with Faricimab
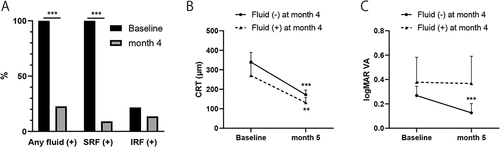
Figure 4 Comparison of visual and anatomic outcome between age-related macular degeneration (AMD) with and without dry macula at month 4. (A) Prevalence of dry macula, SRF, and IRF at baseline and month 4. (B and C) Changes in central retinal thickness (CRT) (B), and logarithm of minimum angle resolution (logMAR) visual acuity (VA) (C) in age-related macular degeneration (AMD) with and without dry macula at month 4. **P < 0.005, ***P < 0.001 compared between baseline and month 4 (B and C).