
Figures & data
Table 1 Preoperative Patient Demographics
Table 2 Postoperative Refractive Outcomes (n = 42 Eyes)
Table 3 Postoperative Visual Outcomes
Figure 1 Monocular uncorrected visual acuities at (A) Distance, (B) Intermediate, and (C) Near and binocular uncorrected visual acuities at (D) Distance, (E) Intermediate, and (F) Near.
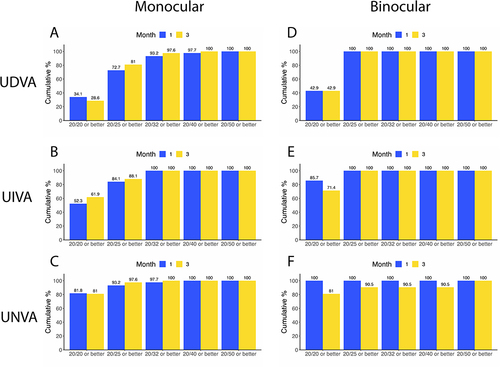
Table 4 Postoperative Task “No Difficulty” or “A Little Difficulty” (Percentage of Subjects)
Table 5 Postoperative Monocular (n = 42 Eyes) and Binocular (n = 19 Subjects) Contrast Sensitivity
Data Sharing Statement
Data are not available for sharing.