Figures & data
Figure 1 Flow diagram of study selection.
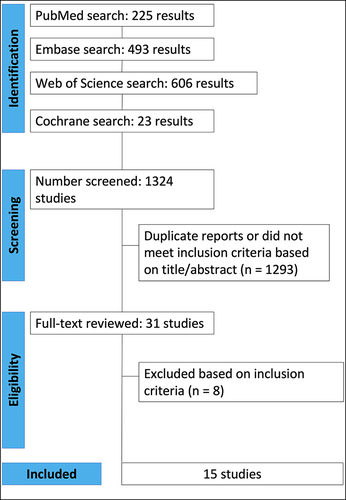
Table 1 Baseline Characteristics of the Studies Included
Figure 2 UCVA forest plot.
Abbreviations: I2, heterogeneity; p, p-value; Pre-CXL, before crosslinking; Post-CXL, after crosslining; SMD, standardized mean difference.
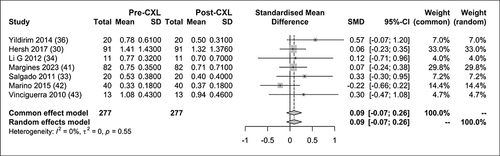
Figure 3 CDVA forest plot.
Abbreviations: I2, heterogeneity; p, p-value; Pre-CXL, before crosslinking; Post-CXL, after crosslinking; SMD, standardized mean difference.
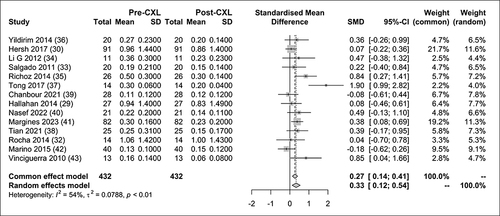
Figure 4 SE forest plot.
Abbreviations: I2, heterogeneity; p, p-value; Pre-CXL, before crosslinking; Post-CXL, after crosslinking; SMD, standardized mean difference.
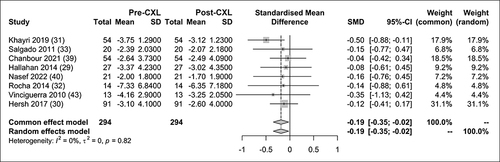
Figure 5 Kmax forest plot.
Abbreviations: I2, heterogeneity; p, p-value; Pre-CXL, before crosslinking; Post-CXL, after crosslinking; SMD, standardized mean difference.
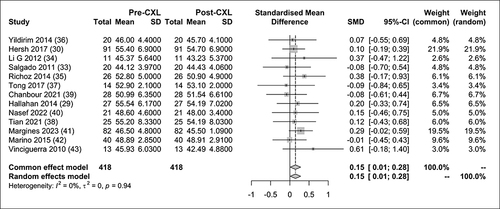
Figure 6 ISV forest plot.
Abbreviations: I2, heterogeneity; p, p-value; Pre-CXL, before crosslinking; Post-CXL, after crosslinking; SMD, standardized mean difference.

Figure 7 IVA forest plot.
Abbreviations: I2, heterogeneity; p, p-value; Pre-CXL, before crosslinking; Post-CXL, after crosslinking; SMD, standardized mean difference.
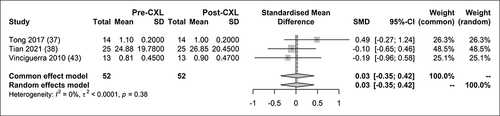
Figure 8 KI forest plot.
Abbreviations: I2, heterogeneity; p, p-value; Pre-CXL, before crosslinking; Post-CXL, after crosslinking; SMD, standardized mean difference.
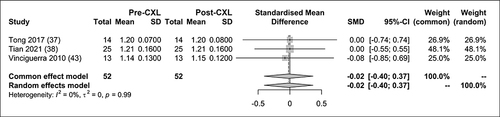
Figure 9 CKI forest plot.
Abbreviations: I2, heterogeneity; p, p-value; Pre-CXL, before crosslinking; Post-CXL, after crosslinking; SMD, standardized mean difference.
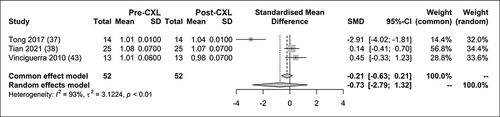
Figure 10 Rmin forest plot.
Abbreviations: I2, heterogeneity; p, p-value; Pre-CXL, before crosslinking; Post-CXL, after crosslinking; SMD, standardized mean difference.
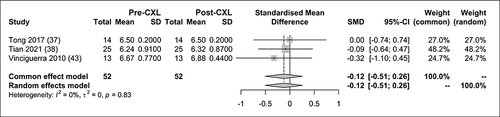
Figure 11 IHA forest plot.
Abbreviations: I2, heterogeneity; p, p-value; Pre-CXL, before crosslinking; Post-CXL, after crosslinking; SMD, standardized mean difference.
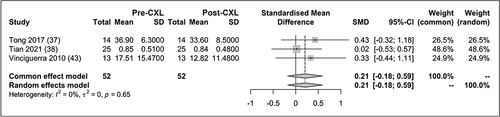
Figure 12 IHD forest plot.
Abbreviations: I2, heterogeneity; p, p-value; Pre-CXL, before crosslinking; Post-CXL, after crosslinking; SMD, standardized mean difference.
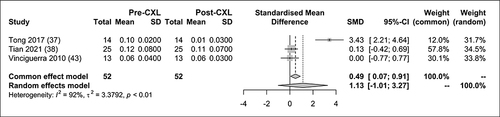
Figure 13 EEC forest plot.
Abbreviations: I2, heterogeneity; p, p-value; Pre-CXL, before crosslinking; Post-CXL, after crosslinking; SMD, standardized mean difference.
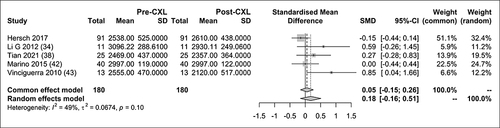
Figure 14 CCT forest plot.
Abbreviations: I2, heterogeneity; p, p-value; Pre-CXL, before crosslinking; Post-CXL, after crosslinking; SMD, standardized mean difference.
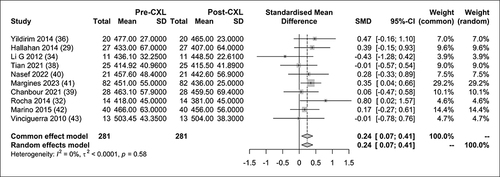
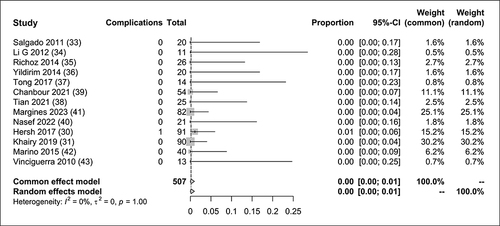
Figure 15 Serious Complications rates.
Abbreviations: I2, heterogeneity; p, p-value; Pre-CXL, before crosslinking; Post-CXL, after crosslinking.