Figures & data
Figure 1 Flow chart of preprocessing, metric calculation, and statistical analysis in this study. Data acquisition of fMRI and T1 in subjects (A) white matter function calculation(B) Differences in white matter function between the two groups and machine learning (C).
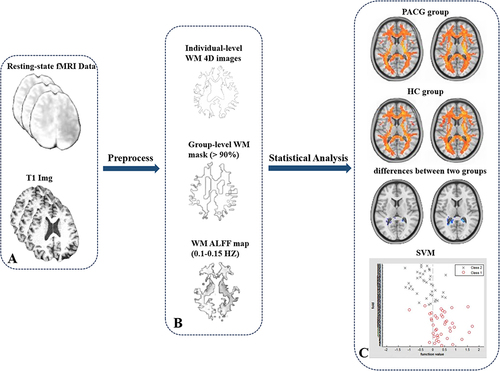
Table 1 Demographics and Visual Measurements Between Two Groups
Figure 2 Results of the two components representing the white matter ALFF signal values by one-sample t-test in patients with (A) PACG and (B) HC.
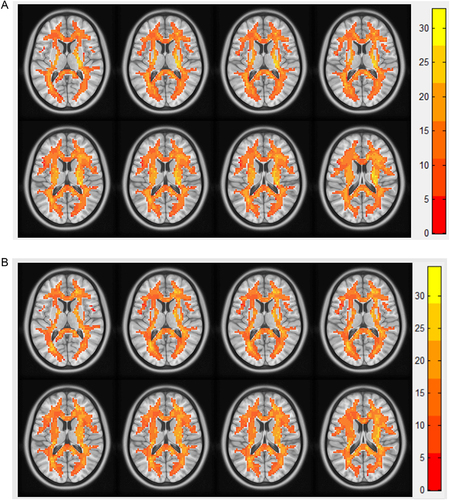
Table 2 Regions of WM Showing Abnormal ALFF in Patients with PACG Compared with HCs
Figure 3 Regions of WM showing ALFF differences between PACG and HC groups.
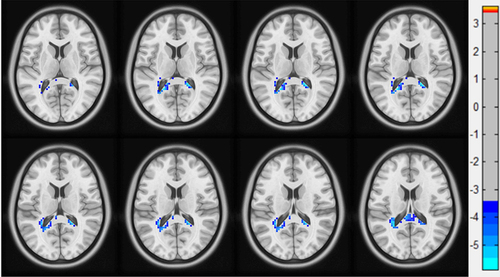
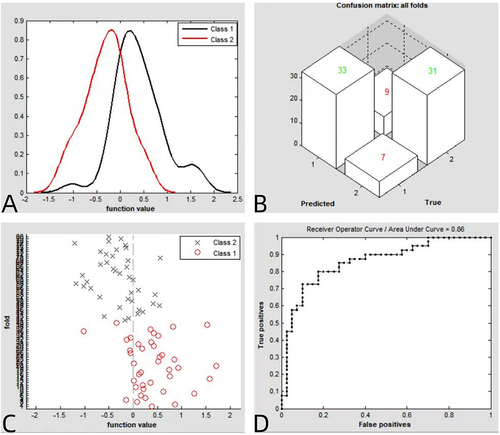
Figure 4 (A)Classification results using machine learning analysis based on ALFF values; (B)three dimensional confusion matrices from machine learning analysis; (C) function values of two groups with a scatter diagram; (D) the ROC curve of the SVM classifier with an AUC value of 0.86. (class 1: PACG group; class 2: HC group).