
Figures & data
Table 1 Demographics and Baseline Characteristics of Eyes in the Total Population
Table 2 Demographics and Baseline Characteristics of Eyes in the Subgroup of American Indian Patients
Figure 1 Mean IOP at baseline and at 1, 6 and 12 months after implant in the overall population with baseline IOP≥21 mmHg and IOP<21 mmHg.
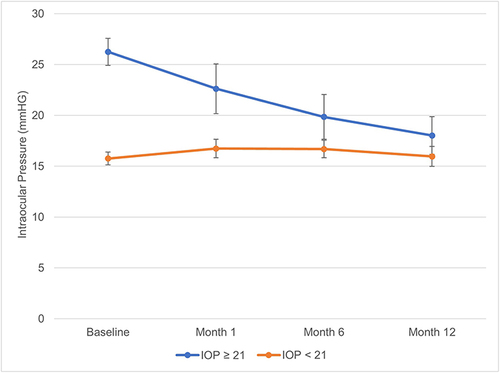
Figure 2 Mean number of IOP-lowering medications at baseline and at 1, 6 and 12 months after implant in the overall population with baseline IOP≥21 mmHg and IOP<21 mmHg.
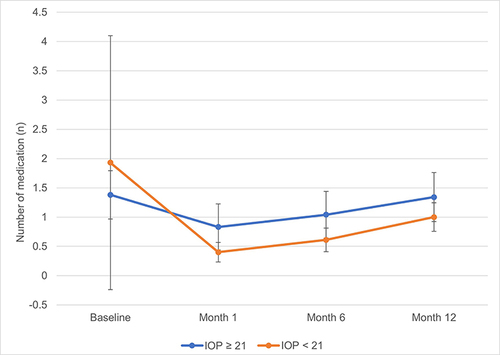
Table 3 IOP and IOP-Lowering Medication Outcomes at Baseline and Each Post-Implant Time Point in the Total Population and Subgroups Differentiated by Baseline IOP of 21 mmHg
Figure 3 Mean IOP at baseline and at 1, 6 and 12 months after implant in American Indian subgroups with baseline IOP ≥21 mmHg and IOP <21 mmHg.
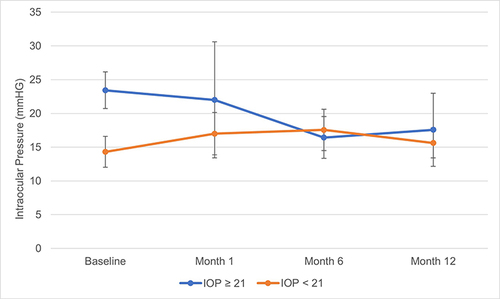
Figure 4 Mean number of IOP-lowering medications at baseline and at 1, 6 and 12 months after implant in American Indian subgroups with baseline IOP ≥21 mmHg and IOP <21 mmHg.
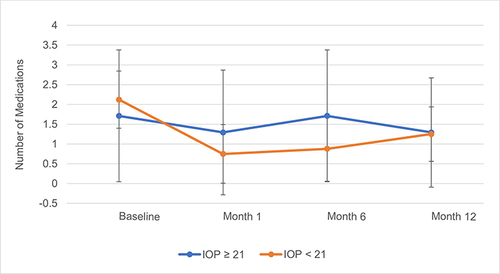
Table 4 IOP and IOP-Lowering Medication Outcomes at Baseline and Each Post-Implant Time Point in the American Indian Population and Subgroups Differentiated by Baseline IOP of 21 mmHg