Figures & data
Figure 1 Fundus photo of the right and left eye.
Notes: (A) The right optic nerve head had diffuse edema with an area of subretinal fluid extending from the temporal border of the optic disc to the nasal macula. (B) The left eye had a cup-to-disc ratio of <0.1 without any evidence of optic nerve edema. (C) Fundus photo of the right eye at 1-month follow-up demonstrates 360° optic nerve pallor after resolution of the optic nerve edema. The area of subretinal fluid adjacent to the temporal optic disc in the nasal macula has resolved.
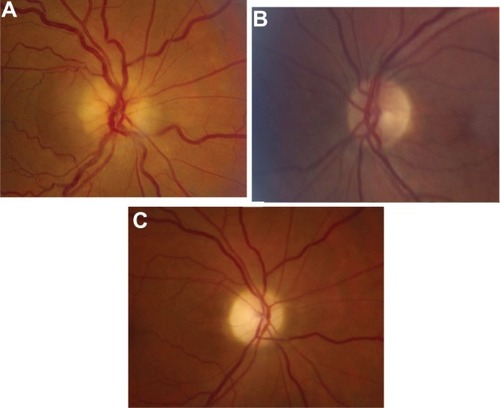
Figure 2 OCT of the optic nerve and macula. (A) Retinal nerve fiber layer analysis demonstrates 360° optic nerve edema in the right eye and no optic nerve edema in the left. (B) Macula OCT demonstrates a small area of subretinal fluid extending from the temporal portion of the optic disc into the nasal macula in the right eye.
Abbreviations: ONH, optic nerve head; RNFL, retinal nerve fiber layer; OU, both eyes; SUP, superior; NAS, nasal; TEMP, temporal; OD, right eye; OS, left eye; OCT, optical coherence tomography; CD, cup to disc.
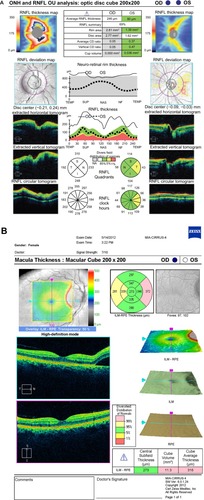
Figure 3 Stimulus V 30-2 Humphrey visual field demonstrates a cecocentral scotoma in the right eye.
Abbreviations: POS, positive; NEG, negative; dB, decibels.
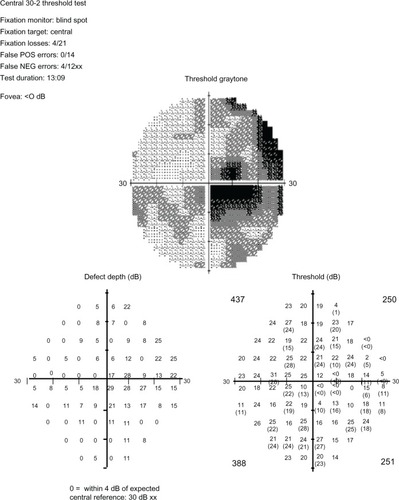
Table 1 Summary of the five previously reported patients with NAION-associated APAC (six eyes) and our additional patient