
Figures & data
Table 1 Participant Characteristics (n = 30)
Figure 1 The scatter plot shows the correlation of LOA between the contrast management and control spectacles in the right eyes of each participant (n=30).
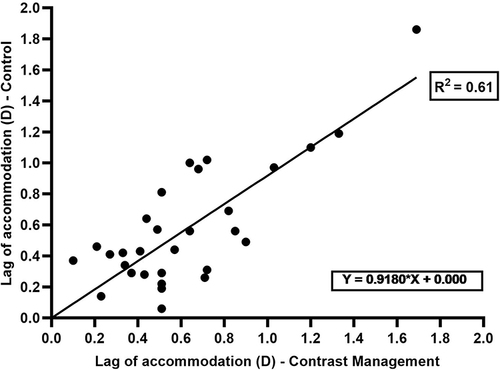
Figure 2 The Box and Whisker plot shows the distribution of LOA with contrast management and control spectacles in the right eye. The circles represent the outliers for the contrast management spectacles and the triangles represent the outliers for the control spectacles.
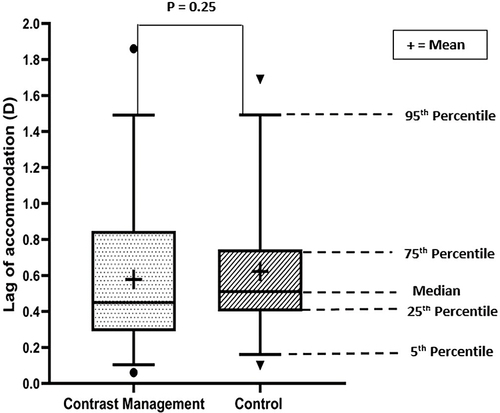
Figure 3 The scatter plot shows the correlation of LOA with contrast management and control spectacles in the dominant eye of each participant.
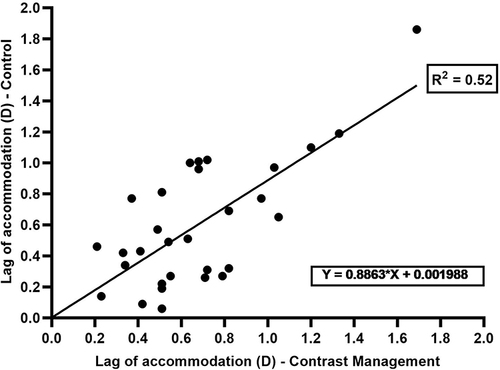
Figure 4 The Box and whisker plot shows the distribution of LOA between contrast management and control spectacles in the dominant eye. The circles represent the outliers for the contrast management spectacles and the triangles represent the outliers for the control spectacles.
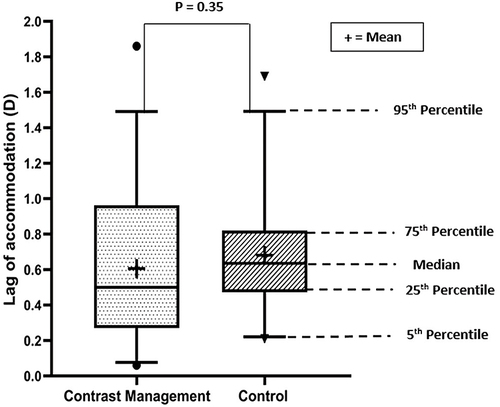
Table 2 Lag of Accommodation with Contrast Management and Control Spectacles in the Right Eye and Dominant Eye for the Age Groups 7–11 Years (n=19) and 12–17 Years (n=11); Mean ± SD, (Median)
Table 3 Lag of Accommodation with Contrast Management and Control Spectacles in the Right Eye and Dominant Eye for Male (n=10) and Female (n=20) Participants (Mean ± SD, (Median))