Figures & data
Figure 1 Gemetric and Gemetric Plus diffractive trifocal design elements (Courtesy Hoya, used with permission).
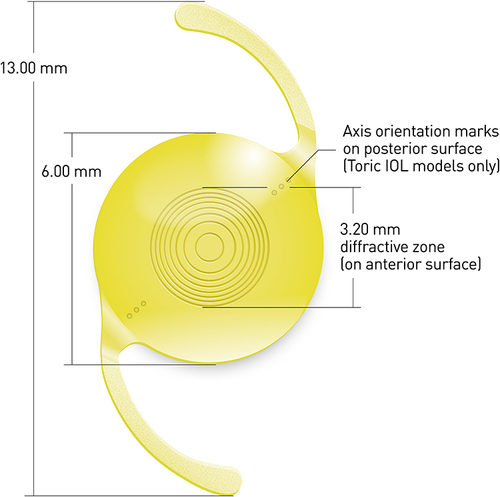
Figure 2 Comparison of the through-focus modulation transfer function by IOL (Courtesy Hoya, used with permission).
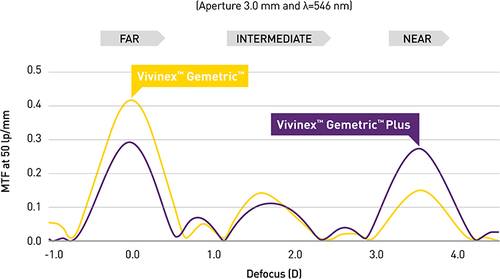
Table 1 Principal Investigator List, NINO Study
Table 2 Group Summary for Analysis
Figure 3 The distribution of refractive outcomes at 6 months postoperative. (A) Mean refraction spherical equivalent (MRSE). (B) Postoperative refractive cylinder.
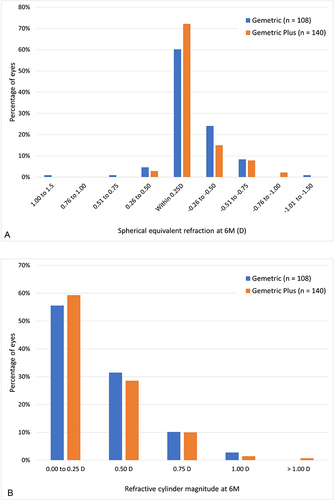
Figure 4 Summary of monocular visual acuity data by lens and test distance.
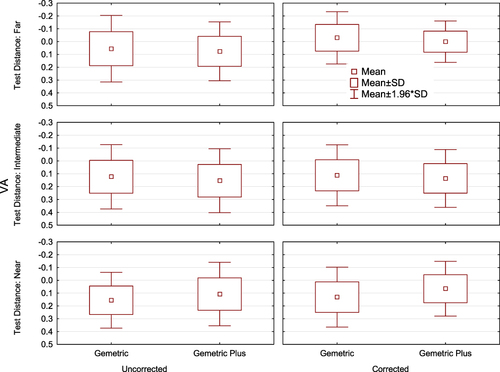
Figure 5 Binocular uncorrected and distance corrected visual acuities by distance and study group. (A) Uncorrected. (B) Distance corrected.
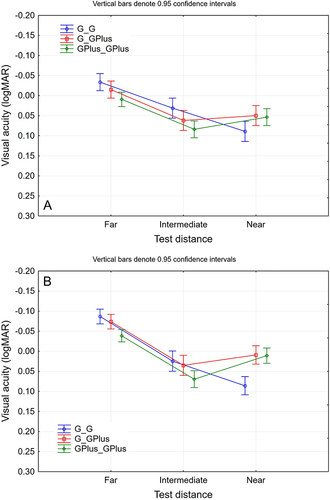
Figure 6 Binocular distance corrected visual acuities in photopic and mesopic conditions by study group and distance.
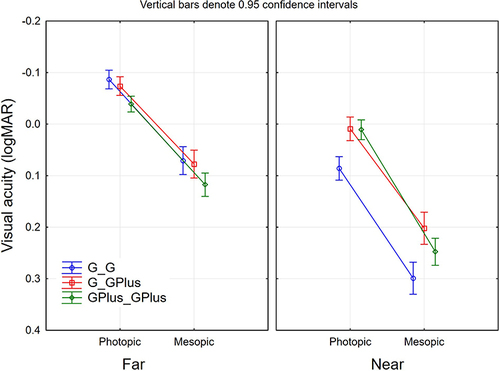
Figure 7 Distance corrected binocular defocus curve by study group.
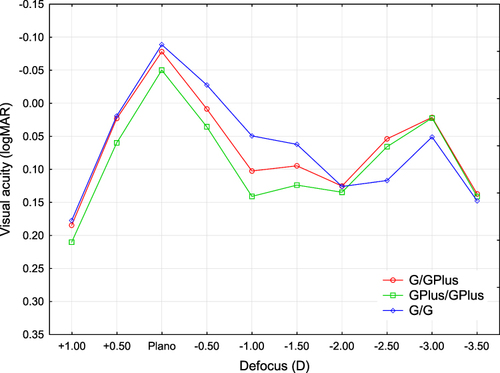
Figure 8 Contrast sensitivity results by study group and test condition. (A) Photopic with glare, (B) Mesopic without glare, (C) MEsopic with glare.
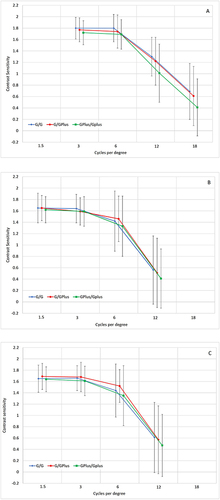
Figure 9 Distribution of the Rasch-scored frequency, severity and degree of bother from visual disturbances.
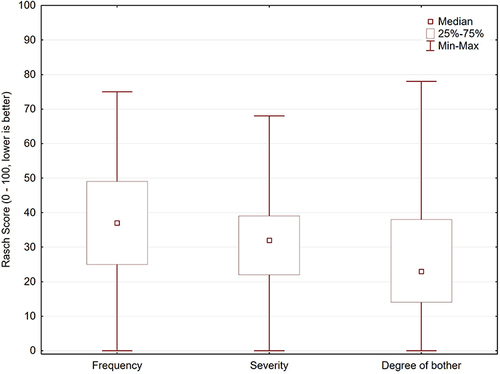
Figure 10 Mean frequency, severity and degree of bother reported for glare, halos and starbursts.
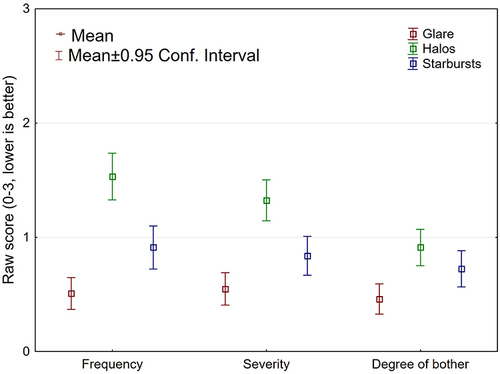
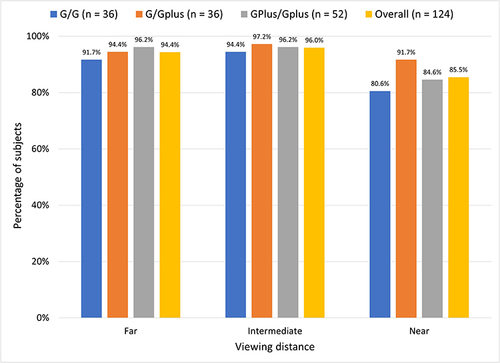
Figure 11 Reported spectacle use of “Never” by study group and viewing distance.